


INTEGRATED MANAGEMENT OF LAND BASED ACTIVITIES
IN THE SûO FRANCISCO RIVER BASIN PROJECT
ANA/GEF/UNEP/OAS
Activity 2.2 C Ù Multitemporal Analisys of the Dynamic of Alteration of the
Conformation of the SÐo Francisco Riverbed Ù Middle Course
Executive Summary of the Final Report
MULTITEMPORAL ANALYSIS OF THE DYNAMIC OF
ALTERATION OF THE CONFORMATION OF THE SûO
FRANCISCO RIVERBED Ù MIDDLE COURSE
Companhia de Desenvolvimento dos Vales do SÐo Francisco e do ParnaÚba
BrasÚlia
INTEGRATED MANAGEMENT OF LAND BASED ACTIVITIES
IN THE SûO FRANCISCO RIVER BASIN PROJECT
ANA/GEF/UNEP/OAS
Activity 2.2 C Ù Multitemporal Analysis of the Dynamic of Alteration of the
Conformation of the SÐo Francisco Riverbed Ù Middle Course
Executive Summary of the Final Report
MULTITEMPORAL ANALYSIS OF THE DYNAMIC OF
ALTERATION OF THE CONFORMATION OF THE SûO
FRANCISCO RIVERBED Ù MIDDLE COURSE
Coordinator
Rui Alcides de Carvalho Junqueira
Companhia de Desenvolvimento dos Vales do SÐo Francisco e do ParnaÚba
Ministry of Regional Integration
Consultants:
Jurema Barbeitos Ribeiro
Albano Henrique de Araºjo
Karla Adriana Carneiro Rosa
Francisco Ant¶nio Braga Rolim
November, 2002
MULTITEMPORAL ANALYSIS OF THE DYNAMIC OF ALTERATION
OF THE CONFORMATION OF THE SûO FRANCISCO RIVERBED Ù
MIDDLE COURSE
EXECUTIVE SUMMARY
INTRODUCTION
The present study corresponds to the Subproject 2.2 C - Multitemporal Analisys of the Dy-
namic of Alteration of the Conformation of the SÐo Francisco Riverbed Ù Middle Course,
which is a component of GEF Ù SÐo Francisco, and subsidies the Strategic Action Program in
what refers to measures to be taken in relation to the erosive and sedimentation process on the
Riverbed of the SÐo Francisco River in its middle course, since this is the most navigable
course of the river.
The conformation of a river is the resultant of the joint actuation of several factors as pluvios-
ity (related to climate), the availability of sediments, geology and geomorphology of the re-
gion cut by the channel, among others. In areas of intense anthropic interference, as is the case
in the greatest part of the SÐo Francisco Riverbed, some of these factors may be affected by
human activities, causing, consequently, alterations on the conformation of the river channel.
In order to evaluate and monitor these interferences, it is required, initially, to characterize,
quantitatively and qualitatively, the alterations of the conformation of the channel occurred
during a representative period of time. This analysis allows defining changes on the natural
dynamic of channel alteration and relating them to external factors, as it may be the case.
Within this context, the multitemporal analysis of the conformation of the channel is the ap-
propriate technique to allow this comparative analysis.
The present analysis was made through the definition of the conformation in two distinct pe-
riods, beginning in the end of the forties, between the years of 1946 and 1948, using maps
produced based on aerial investigation and the images of the sensor ASTER (Advanced
Spaceborne Thermal Emission and Reflection Radiometer) of the satellite TERRA, launched
in December, 1999 as part of a NASA system for land observation. These images provided
the information regarding the present conformation of the channel.
Once understood and defined this dynamic, it was possible to indicate directives for the better
management of water resources of the SÐo Francisco Basin, which inserts itself on the aims
established by the federal government, in the context of the SÐo Francisco Project.
Subproject 2.2.C intends, as a general objective, to determine the dynamic of alteration of the
conformation of the SÐo Francisco Riverbed, contributing to the Strategic Action program for
the SÐo Francisco River Basin - PAE, in the context of the SÐo Francisco Project
(ANA/GEF/PNUMA/OEA).
These are the specific objectives of this subproject:
- To determinate the conformation of the surface of the SÐo Francisco riverbed in two
different periods Ù between the years of 1946 and 1948 and between 2000 and 2001
(presented at chapter 7, annex 1 Ù Results of Data Crossing Results);
- To identify the alterations occurred on this conformation between the analyzed periods
(presented on chapters 8 and 13 and on annex 1 Ù Results of the Data Crossing);
- To establish a model for the dynamic of alteration of the conformation of the channel
(discussed on chapter 13 and summarized on the conclusion Ù chapter 14).
i
1. PHYSICAL CHARACTERIZATION OF THE SûO FRANCISCO MIDDLE
COURSE
1.1 Localization:
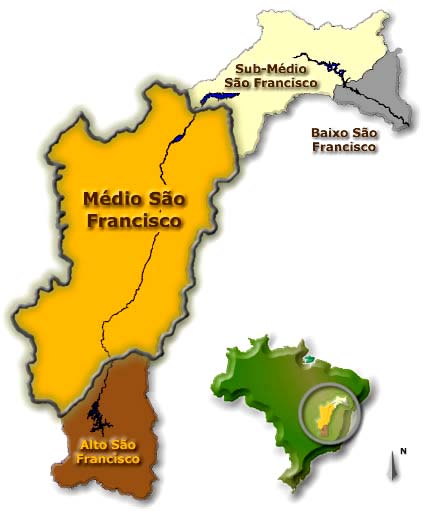
The SÐo Francisco River Basin is divided in four physiographic regions, named from up-
stream to downstream, Upper, Middle, Sub-middle and Low SÐo Francisco. Figure 1 presents
the relative position of these four regions.
Figure 1. Subdivision of the SÐo Francisco River Basin on physiographic regions.
The region of the Middle SÐo Francisco comprehends the course from the city of Pirapora, on
the state of Minas Gerais (MG) to the city of PilÐo Arcado, on the state of Bahia (BA), includ-
ing the sub-basins of the tributary PilÐo Arcado, on West, JacarÕ, on East, and besides these,
the sub-basins of the Rivers Paracatu, Urucuia, Carinhanha, Corrente, Grande, Verde Grande
and Paramirim, which are all located in the two states previously mentioned.
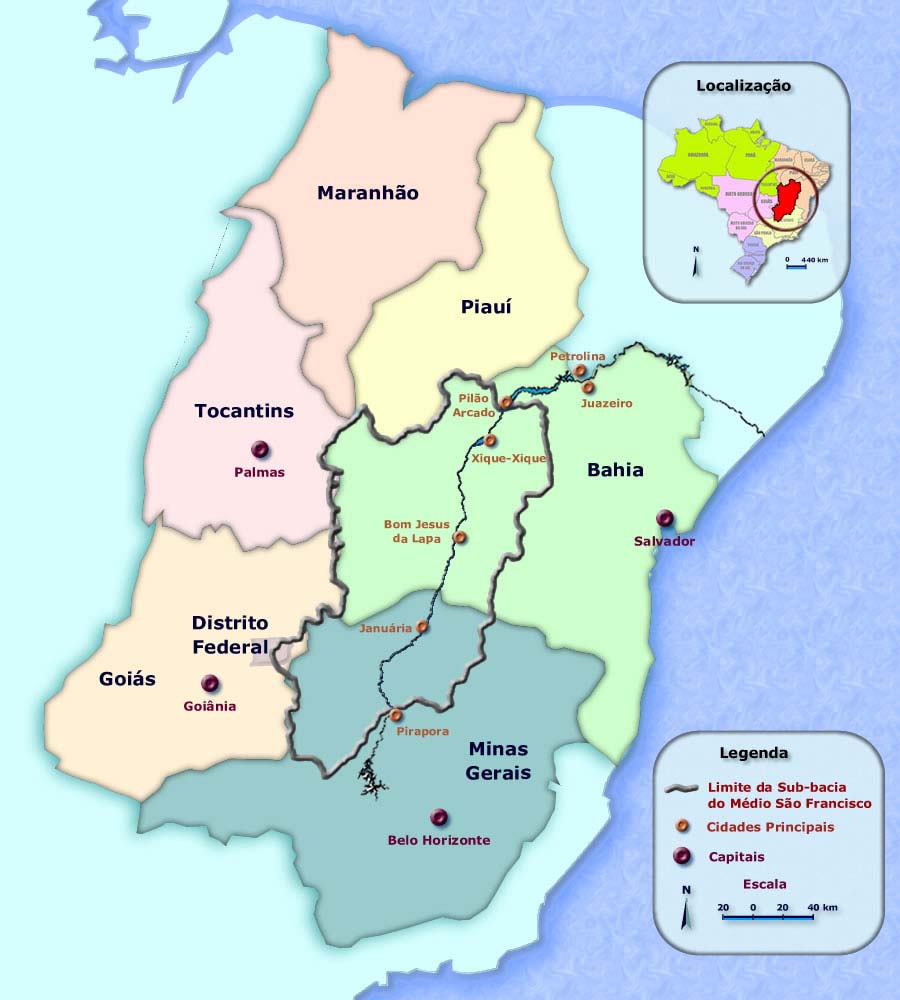
The study area of the present study corresponds to the course of the Middle SÐo Francisco
placed on the chute of the river, flowing until upstream of PilÐo Arcado, in the beginning of
the Sobradinho water reservoir, delimited by the coordinates Ù45¤30" W, -17¤30" S e Ù42¤00'
and Ù09¤45'. Figure 2 presents the localization of the area.
1.2 Weather
The usual climate of the Middle SÐo Francisco River is dry sub-humid and semi-arid, present-
ing rain on the Summer (from November to April) and average annual precipitation of
ii
600mm on the area eastward the Sobradinho water reservoir, and 1.400mm on the West limit
of the Basin.
As the area of study of the present research is restricted to the neighboring area of the SÐo
Francisco River, it is observed that in its greatest part, the area presents a semi-arid climate,
and on the upstream area, close to Pirapora (MG), occurs the semi-humid climate. The climate
characteristics of the area are presented on Figure 1.
Figure 2. Localizing of the study area.
iii
Chart 1.Climatic data of the regions of the SÐo Francisco River Basin. Source:
DNAEE/1983
Region
Climatic elements
Upper Middle
Sub-Middle
Low
Temperature(¤C)
18
27
27
25
Relative Humidity (%)
76
60
60
73
Evaporation (mm/year)
2.300
2.900
3.000
2.300
Precipitation (mm/year)
1.600/1.200
1.600/400
800/350
400/1.300
1.3 Vegetal
covering
Considering the original vegetation, on the Middle SÐo Francisco there can be found four ty-
pes of vegetal covering:
ñ Decidual Stationary Forest: is characterized by foliar seasonality of the dominant arbo-
real elements, determined by a climate of two well-distinguished seasons: one rainy and
the other with a deep termichal variation.
ñ Cerrado (a sort of Savannah): predominates on the humid and sub-humid climate re-
gions, with soils of low fertility. The great domain of this kind of vegetation, which covers
around 33,9% of the Valley, is placed in Minas Gerais and in the West of Bahia (Upper
and Middle SÐo Francisco).
ñ Caatinga (dry region with stunt vegetation): is the vegetation of the arid and semi-arid
regions. Predominates on the states of Bahia, Pernambuco and west of Alagoas and Ser-
gipe, covering 21,2% of the Valley. Physiographicaly, it is placed on the Middle, Sub-
middle and Low SÐo Francisco River.
ñ Transition zone Caatinga-Cerrado: an area that presents the characteristics of both
Caatinga and Cerrado, grading from one the other.
1.4 Hydrographs
The Basin presents vast and dense drain network, with superficial, perennial and intermittent
watercourses, being the latter more typical of the Sub-middle and Low SÐo Francisco regions
and of the right riverbank of its Middle course.
The SÐo Francisco River flows through regions that present the most varied natural condi-
tions. The extreme parts of both the superior and inferior part of the Basin present high pluvi-
ometric rates, while its Middle and Sub-middle course flow through areas of dry weather.
Therefore, around 75% of the flowing of the SÐo Francisco River is generated on the state of
Minas Gerais, even though only 37% of the total Basin area is placed on this state.
The area between the border Minas-Bahia until the city of Juazeiro (BA) represents 45% of
the Valley and contributes with 20%of the annual flowing.
1.4.1 Navigable
courses
The SÐo Francisco River offers natural conditions of navigation between Pirapora-MG and
PetrolinaPE/Juazeiro-BA during the whole year, presenting variations of draft according to
the rain regime.
Due to the diverse physical characteristics through this navigable course, it is divided in three
sub-courses, as follows:
iv
From Pirapora (MG) to PilÐo Arcado (BA)
From PilÐo Arcado (BA) to the Sobradinho Dam (BA)
From the Sobradinho Dam (BA) to Petrolina (PE)/Juazeiro (BA)
1.4.2 General conformation of the riverbed:
The SÐo Francisco River flows a South-North course until the confluence with the Urucuia
River, where it starts to present a South-Northeast steep arch which changes its inflection
close to MorparÃ, and ends close to the city of Cabrobµ, then spinning Southeast, on a near
straight line until the mouth of the river.
1.4.3 Main
tributaries:
The SÐo Francisco River has 36 tributaries, from which only 19 are perennial. Among those,
eight had its mouth in the region studied. From this total, the most important are those of the
left riverbank, where the first, from upstream to downstream, is the Paracatu River, with a ba-
sin of 45.203 kmý. Following is the Urucuia River, with a basin of 25.406 kmý.
Then going downstream is the Carinhanha River, a basin of 17.028 kmý. The following is the
Corrente River, with a basin of 34.253 kmý. And at last is the Basin of the Grande River, with
a basin of 78.491 kmý, which represents the largest sub-basin of the SÐo Francisco.
On the right riverbank, the main tributaries are, from upstream to downstream, the rivers
Paraopeba, das Velhas, JequitaÚ and Verde Grande. The Paraopeba River has a basin of
13.910kmý, flowing out directly on the reservoir of Trõs Marias.
The das Velhas River is the most important affluent of the right riverbank, upstream from
Trõs Marias, with a basin of 27.897 kmý. Downstream the most important are, with a basin of
8.570 kmý, the JequitaÚ, and the Verde Grande River, with a basin of 31.321 kmý.
1.4.4 Accumulation Dams:
On the studied course, it has been introduced two large dams of accumulation. The dam of
Trõs Marias, built by the predecessor of CODEVASF (CVSF Ù Commission for the SÐo Fran-
cisco Valley), started to operate in 1961, and regularizes the flowing of the Upper SÐo Fran-
cisco and also of the tributary upstream Trõs Marias, in Minas Gerais.
This regulation exerts effects until the outskirts of Pirapora, in Minas Gerais. It accumulates a
maximum volume of 19.528 hm°, or 568,3 m (above sea level), flooding an area of 1.022 kmý.
Downstream is the Sobradinho Dam. Built by CHESF (Hydroelectric company of the SÐo
Francisco), its operation started in 1979. It regulates the flowing of the main tributaries of the
SÐo Francisco River. It stores a maximum volume of 34.116 hm°, or 392,5m (above sea
level), flooding an area of 4.214 kmý. The stillwater of its reservoir is defined until the section
placed on the city of Xique-Xique, in the state of Bahia.
There are dozens of small dams distributed over the tributaries of the hydrographic region
studied, with individual accumulation below 2 hm°.
1.4.5 Analysis of Transversal Profiles:
Due to the fact that is presents a mobile deep part, the navigable channel changes its position.
The analyses of the transversal profiles in different periods of time shows the mobility of the
deep part, as it can be seen in Figure 7, which presents two moments of bathymetry of the sec-
tion of the SÐo Francisco River at the fluviometric station in the city of SÐo Francisco.
It can be noted that between 1973 and 1983 there was a great change in the profile, with an
extended area of sediments placed close to the right riverbank which suffer the effects of ero-
sion and that are not present on the second profile. This conspicuous difference between the
two periods may be associated to deep changes on the channel suffered probably during the
v
great flood of 1979, when, as indicated on the figure, the highest watermark reached on the
period was 13,48 m.
The lowest level observed since the beginning of the measuring occurred in 1958, when it was
registered the lowest watermark - 1,04 m.
1.4.6 Great
floods:
The great floods that hit the alluvial plains may change the conformation of the riverbed. The
SÐo Francisco River Basin, in this course, faced four great floods in the years of 1919, 1926,
1979 e 1949, in order of magnitude.
The amounts of water that came from the sub-basins that flow along the SÐo Franscisco River,
within the studied course, are not uniform. The correlation between the highest annual flow
observed in the city of Pirapora and in the city of SÐo Francisco shows that, in average, the
discharge in the latter corresponds to more than the double of the former. In this course be-
tween Pirapora and SÐo Francisco, the River receives the contribution of its three largest con-
tributors, the das Velhas River, the Paracatu River and the Urucuia River.
Figura 7. Transversal profiles of the SÐo Francisco River on the city of SÐo Francisco,
obtained in 09/14/1973 e 08/06/83 (vertical extrapolation Ù 20x).
vi
Available historical series:
To proceed an analysis of the floods occurred on the studied course, it was used data from
flows and daily average levels from the pluviometric stations run by CHESF, with a period of
observation that includes two large floods, which are, 1949 e 1979.
It was also used an aleatorious flood (1983) with highest flows surpassing 8.000 m3/s (which
generated the overflow of the first riverbank) to assist the analysis.
Information crossing on hydrological critical events and changes on the
conformation of the riverbed
It was analyzed the behavior of the pathway of the highest floods along the studied course,
aiming to find where occurs lamination of the leaked out volumes. This effect is caused by the
overflow of the smaller riverbeds, allowing a great volume of water run through the alluvial
plains, resulting on a decrease on the speed of draining on floods and the following temporary
storage of a part of the water volume from the flood hygrogram, which means, causing the
flattening of the hygrogram, which is the effect of lamination.
The sequence of the hygrograms of the three floods analyzed (figure 11 presents an example
of the 1949 flood) shows that between the cities of SÐo RomÐo and SÐo Francisco it does not
exist any difference on the format of the hygrograms. The peaks are similar and differ only in
magnitude of the flows.
vii
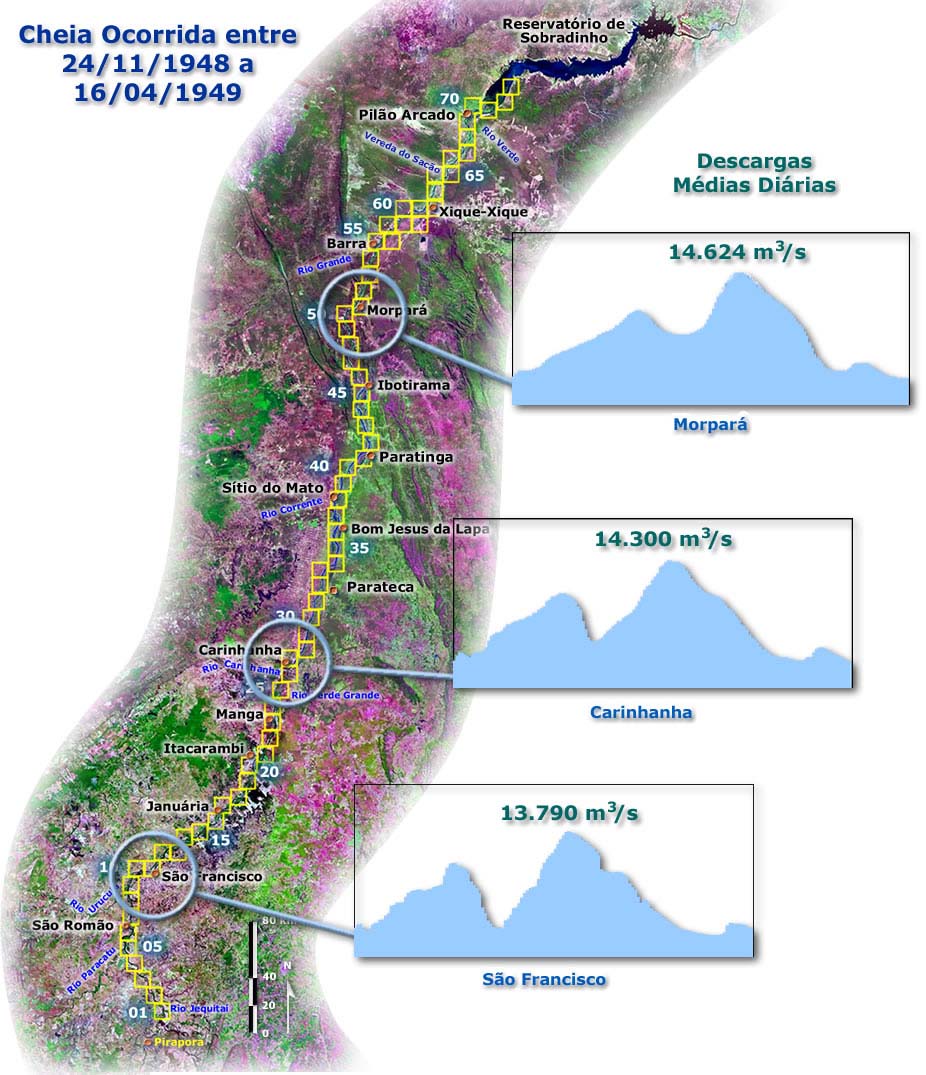
Figure 11. Average daily discharges of the flood occurred between 11/24/1948 a
04/16/1949.
This characteristic indicates that the hygrograms are conduced without dimming, and the in-
crease of that flows can be explained by the fact that between these two measurement stations
there is the contribution of the Uruciuia River. In this course, the channel of the river was
deep enough so that these analyzed floods did not advance through the alluviate plains.
Between SÐo Francisco and Carinhanha the sequences of the hygrograms already show an ef-
fect of lamination, and as an example it can be found in the small flood of 1983 a decrease of
the peak, which means a flattening of the flood hygrogram. This is a feature of dimming. This
effect is increased on the following course, between Carinhanha and MorparÃ.
It is hoped to find in this area more significant changes on the river chute, in comparison with
the topographic charters of the ends of the forties and the satellite images of 2000 and 2001.
viii
The changes found in the conformation of the riverbed are more stressed upstream of the city
of SÐo Francisco, confirming the hypothesis of overflowing of the minor riverbed and the
power of the floods of provoking more stressing alterations on the channel.
1.5 Geology
As a general picture of the geology of the area and its surroundings, it is presented a study of
the geologic environment of the Basin, from upstream (Upper) to downstream (Low), of the
geological units or sequences, since they are the geological formations of greatest interest for
the obtaining of data related to geology, geomorphology, types of soil and vegetation, so that
the geomorphologic and sedimenthologic studies can be conduced.
1.5.1 Complex of the terrains Migmatic-Granulite, Granitoid and Granite-Greenstone
Non-Differentiated, total or partially re-travailed on the cycles Transamazonic
and Brazilian
This complex corresponds to the sequence7 of the map in figure 15 and comprehends an asso-
ciation of polimetamorphic rocks of high and medium degree, supposedly from the Arquean
period (Pre-Cambrian), with flooded migmatic units and metatetic gneisses. Less frequently
there are rocks of a more homogeneous composition, which cut the migmatities during intru-
sive contacts.
1.5.2 Vulcan-Sedimentary Sequences of the Differentiated Greenstone-Belt Type
They correspond to the sequence 8 of the Map in Figure 15 and are composed by geologic
units of low and medium metamorphic degree and fit Arquean migmatic complexes in the re-
gion of the QuadrilÃtero FerrÚfero (a quadrilateral formed by four cities where there are one of
the largest iron deposits in Brazil) and are composed by geological units of low and medium
metamorphic degree and fit Arquean migmatic complexes in the region of its surroundings,
portraying the fact they were not much affected by metamorphic re-travails.
1.5.3 Coverings and folding strips, from the Proterozioc Period
They correspond to sequence 2 on the map in figure 15 and they are related to the geologic
formations of the BambuÚ Group, subgroup Paraopeba, Formation Trõs Marias, Formation Je-
quitaÚ; Group Una; and Formation Bebedouro, with extension on the studied course of the Ba-
sin, on the states of Minas Gerais and Bahia.
1.5.4 The Fanerozoic Coverings:
They correspond to the sequence 1 of the map in figure 15 and they are the mainly responsi-
ble, in quantitative terms, for the volume of water flow that contributes for the perenization of
the SÐo Francisco River on the studied course.
Its dimensional and hydrological characteristics, added to its climatology, vegetal covering
and its soils, in the context of the Basin, allow a larger storage capacity and a later ease to lib-
erate water (transmissivity), contributing in a larger degree for the perennization of the SÐo
Francisco River (due to the base discharge of these aquifers), which is of the effluent type.
1.5.5 Comments on the relation between geology and the production of sediments on
the Basin:
Upper SÐo Francisco
The geological characteristic of this course is influenced by the rock formations with deformi-
ties, flooding, fails, abatements and slight lifts that provoked the formation of a complex set
of mountain chains, forming structures of a diversified configuration on the forms and types
of the rocks.
ix
Figure 15. CrÃton Sanfranciscano. Source: Geologia do Brasil/DNPM (1984) Ù Modified:
Braga Rolim, F. A.
The geologic pattern of the Upper Course of the River turns this region into the most impor-
tant as a provider of sediments for the riverbeds, since the rocks of the geologic formations
are considered very ancient, with an average age around 450 million years.
Ancient rocks, placed in zones tectonically hit, tend to disintegrate or alter in a higher speed if
compared to younger rocks, since the mineral grains are less cohesive, more fragmented, turn-
ing its carrying more easy by erosive processes.
This means that a larger amount of solid debris is liberated from the rocks, and then it is pro-
vided a great volume of sediments to the riverbeds. Allied to a favorable geology, there is
climate and salience, natural conditionings for the actuation of erosive processes.
Middle SÐo Francisco
The geological meaningful feature is the fact of being a sedimentary basin, with a topography
that presents few accidents, inserted on a region of depressions with a low hydraulic gradient,
especially those coming from sub-basins from the Upper-SÐo Francisco.
It constitutes then in a more receiving and sediment accumulator region, with a high degree of
silting up. In this context, it easily occurs the gathering of high rates of sediments along the
riverbanks and chutes of the rivers, specially the SÐo Francisco.
These sediments normally are unconsolidated, easy to be changes by the normal flux of water,
and in larger intensity in the periods of rain, which causes continuous erosive processes on the
riverbanks, with frequent changes in the format of the riverbanks and the riverbeds.
x
Its dimensional as well as hydrologic features, added to climathology, vegetal covering and
soils, in the context of the basin, allow a larger storage capacity and a posterior ease in liberat-
ing water (transmissivity).
1.6 Geomorphology
For this study, it is described the main features and geomorphologic types presently dominant
in the regions of the Upper and Middle SÐo Francisco, considering that a geomorphologic
domain comprehends the macro-structures of the salience physionomically similar in its forms
and types.
1.6.1 Geomorfogenesis of the Upper and Middle SÐo Francisco
In general terms, the riverbed of the SÐo Francisco River flows through zones of fit terrains,
with its course following preferential directions (geologic fails, depressions) and varied forms
of salience, which means, a riverbed fit in zones of mountains and plateaus, as for the Upper
SÐo Francisco, and a riverbed fit in zones of flat mountains and plains, as for the Middle SÐo
Francisco.
The structural and litologic bases, associated to influences of climates of the past, sculpting
levels of planning over the structures, are print on the present morphology, which makes evi-
dent the regional compartments intimately related to the geologic history of the Basin.
1.6.2 Geomorphologic
Characterization of the Upper SÐo Francisco
The geomorphologic representation of the Upper Course is better characterized on the morph
structural domains of the Reminiscent of Folded Chains, in the Inter-plateau Depressions of
the SÐo Francisco and in the Exposed Shield, which subdivisions and brief description is pre-
sented on Chart 3.
Chart 3. Geomorphologic Representation of the Upper SÐo Francisco.
Domain
Region or Unit
Geomorphologic Characteristics
Divides the basins of Rivers SÐo Francisco
Canastra Plateau
and ParanÃ. Formed by plain tops and high
Reminiscent of
plateaus.
Folded Chains
"QuadrilÃtero FerrÚfero".
The relief divides itself in crests and lines
(Iron Quadrilateral)"
of ridges, with average height of 1000 m.
It has the SÐo Francisco River in the central
Inter-plateau
Depression of the Upper
part of all draining. The soils are a mixture
Depressions
SÐo Francisco
of sand and clay, thick, dark red colored,
protected by reminiscent forests and sa-
vannah, clayey, thin, covered by the savan-
nah.
Exposed Shield
Center-South of Minas
Dissected relief with unleveled topography
and a thick mantle of intemperance, and
Plateau
height from 500 e 1.000 m.
1.6.3 Geomorphologic Representation of the Middle SÐo Francisco River.
In the region of the Middle Francisco, the main geomorphologic units studied by the Project
Radambrasil are represented by the Domain of the Plains of Recent Accumulation, Domain of
Plain Depressions, Domain of Plateaus in Concordant Sedimentary Structures and Domain of
Plateaus in Folded Sedimentary Structures. The characteristics of these units are synthesized
on Chat 4.
xi
Chart 4. Geomorphologic Representation of the Upper SÐo Francisco
Domain
Region or Unit
Geomorphologic Characteristics
Plains of Recent
Fluvial Plains
Relief with low declivity, constituted by alluviums
Accumulation
(terrains and meadows)
Plain depressions
Relief with average heights between 400 and 600
m. The predominant features are plains with detri-
tus covering, mainly sandy, containing locally
pebble and clays.
Plateaus in Sedimentary
Relief between 400 and 1.400 m. Predominate the
concurrent Structures
modeled plains degraded in different topographic
levels on sandstone of the formation Urucuia and
rocks from the group BambuÚ.
Plateaus in Folded
Is characterized by the large variation in height,
Sedimentary Structures
from 600 to 1.650 m; contrast between the fea-
tures of geomorphologic structures of differential
dissection closely related to the tectonic (valleys
and structural furrow, crystals, scarps) and mod-
eled plains degraded and retouched.
1.6.4 Comments on the geomorphologic patterns of the Upper and Middle SÐo
Francisco
Upper SÐo Francisco
It is a region of an intercalary relief, with hills and depressions, where the former, throughout
the years, are being exhumed and dissected, and the latter are filled and work immediate as a
baffle wall against the sediments eroded and transported from higher zones, then impeding or
retarding a great amount of sediments from going to the SÐo Francisco riverbed.
This region starts on the contact of two chains of mountains (Serra da Canastra and Serra da
Pimenta) where the SÐo Francisco River starts to flow, from its nascent, until the city of
Doresµpolis, in the state of Minas Gerais.
It is the result of the conjunction of the actuation of a recent morphogenesis which provoked
the formation of depressions on the margins of the mountains, occurred on the Cretaceous
(144 to 65 million of years ago), with a following sedimentation, derived from the immediate
and continuous reception of eroded material (sediments, debris) of the Canastra Plateaus, on
the West, and Serra do Cigano, on the South, and Serra da Pimenta, on East-Southeast.
Middle SÐo Francisco
The most important physical feature is the not very accidental topography, inserted on a re-
gion of depressions with low hydraulic gradient, which favors sedimentation of the material
originated of erosive processes, in special those proceeding from sub-basins of the Upper SÐo
Francisco.
It is a region that receives and accumulates sediments, with a high degree of silting up. In this
context, it occurs easily the accumulation of heavy charges of sediments along the riverbanks
and chutes of the rivers, specially the SÐo Francisco.
These sediments normally are unconsolidated, easy to be eroded and carried by the normal
flow of water, and in periods of higher pluviometric intensity, which provokes continuous
erosive processes on the riverbanks, with frequent change on the form of the riverbanks and
riverbeds.
xii
2. SÆCIAL-ECONåMIC CHARACTERIZATION OF THE MIDDLE SûO
FRANCISCO
2.1 Municipal Division and Demographics
The study area, which corresponds to the chute of the SÐo Franscisco River and its surround-
ings, covers part of 32 municipalities, being 14 on the state of Bahia and 18 on the state of
Minas Gerais.
Chart 7 presents a sum total of the amounts referent to both states. It can be noted that, for the
whole area, there has been an increase of 4,4% on population in the period between 1996 and
2000. Urban population exceeds rural population in 17,12% and demographic density is 7,01
hab/km2.
Chart 7 Resume of the demographic situation of the studied area
Population
Density
Municipality
2000
Area
1996 2000 %
(hab/km2)
Urban Rural
Bahia 354.636
365.265
+3,00
190.626
172.639
60.257,30
6,06
Minas Gerais
281.207
298.925
+6,30 165.499 131.429 34.755,33
8,60
Total 637.839 666.190 +4,44 356.125 304.068 95.012,63
7,01
2.2 Transportation
2.2.1 Highways
In what transportation is concerned, the region of the Middle SÐo Francisco is the most de-
prived, when we take in to consideration the whole Valley of the SÐo Francisco River.
The transportation infrastructure is still insufficient, considering the demand of the region, es-
pecially in what the rural area is concerned. The state of maintenance of the roads is precari-
ous.
2.2.2 Trains
The Centro-Atlãntica Railroad Ù FCA Ù operates a network of 7.080 km in metric gauge,
comprehending the states of Sergipe, Bahia, Minas Gerais, GoiÃs, EspÚrito Santo, Rio de
Janeiro and Distrito Federal. It constitutes the main link between the Southeast Region with
the Northeastern and Center-West Region.
In relation to its area of actuation, FCA connects itself to the main Brazilian railroads and to
important ports (both fluvial and maritime), such as Salvador (BA), Aratu (BA) e Vitµria
(ES), besides Pirapora (MG) and Juazeiro (BA), which are on the SÐo Francisco river itself.
2.2.3 Fluvial
With its extremity on the South being the city of Pirapora (MG), the waterway of the SÐo
Francisco is connected by railroads and roads to the most important economic centers of the
Southeastern Region, besides the fact that it is part of the "exportation corridor" Center-East.
On the North, in the neighboring cities of Juazeiro (BA) and Petrolina (PE), the waterway is
connected to the main capital cities of the Northeastern Region, due to the privileged geo-
graphic position of these two cities.
The most important port on the Middle SÐo Francisco is Pirapora Port (MG), which is con-
nected to the fluvial ports of Petrolina (PE) and Juazeiro (BA) and to the maritime ports of
Vitµria (ES), Rio de Janeiro (RJ), Santos (SP), Salvador (BA), Recife (PE) e Suape (PE),
through roads and railroads.
xiii
2.3 Public
Health
The condition of health on the Middle SÐo Francisco are precarious, specially on the poor
suburbs and on the rural area of the large cities, where it can be seen a high level of under-
nourishment and also a high occurrence of infectious and parasite diseases.
This situation is worsened by the lack of proper medical care, in both emergency and non-
emergency cases, on the great majority of cities on the region.
2.4 Sanitation
Basic sanitation in the Middle SÐo Francisco is precarious. In the municipality of JanuÃria, in
the state of Minas Gerais, only 40% of the total population is served by the public water sys-
tem.
The lack of access to basic sanitation generates severe health problems on the population;
which presents several of hydro transmissed diseases.
2.5 Education
The educational field also presents serious problems in relation to both the infrastructure and
the quality of the education provided to the population.
The number of schools is also not adequate for the demand in the region.
2.6 Productive
activities
Agriculture depends of the availability of water and proper soil. Fishing activity is disorgan-
ized and still uses rudimentary boats and equipment. There is an almost absolute lack of
statistics concerning fishing on the Middle SÐo Francisco.
In the region it is economically noteworthy the manufacturing of iron alloys, spinning and
weaving, garment production and industrialization of food, all in the region of Pirapora and
the production of tomato, industrial processing of corn and coffee, irrigation equipments pro-
duction, as well as sugar and alcohol in the cities of Juazeiro and Petrolina.
2.7 Tourism
Tourism in the Middle SÐo Francisco is limited to only a couple of spots:
2.7.1 Region of Bom Jesus da Lapa
The nature of touristic interest in the region is a religious one. The region is always receiving
low-income pilgrims, which, in their majority, go to the city of Bom Jesus da Lapa by truck.
Tourism does not present high perspectives of improvement for the whole area, since tourists
are essentially very poor, which does not lead to an improvement on the hotels condition.
2.7.2 Region of Petrolina-Juazeiro
The great attraction in this area is the lake of the Dam of Sobradinho, which was built to regu-
late the pluriannual flow of the SÐo Francisco River and then avoid the flooding of many cit-
ies on its margins and the collapse of the electric power generation during the dry weather
season. The Sobradinho lake is, still on our days, on the largest artificial lakes in the whole
world.
3. CONSIDERATIONS ON THE HYDROSEDIMENTOLOGY OF THE SûO
FRANCISCO BASIN
3.1 Production and carrying of sediments
Due to its physiographic characteristics, specially geology, relief and climatology, which act
as natural exogenous agents, and activities developed for use and occupation of the land (sec-
xiv
ondary anthropic exogenous agents), the SÐo Francisco River Basin has a larger production of
sediments on its Upper Course, where the sub-basins of the Paraopeba e das Velhas River rep-
resent the ones which present the highest concentration, as it can be seen on Figure 25.
Figure 25. Average concentration of sediments in suspension in the rivers of the SÐo
Francisco River Basin.
It can be noted that the high concentration of sediments on the riverbed of the SÐo Francsico
is observed until the backwater of the reservoir of Sobradinho. Downstream from this point
there is a considerable reduction in the amount of sediments, due to the decrease of speed of
the flow.
xv
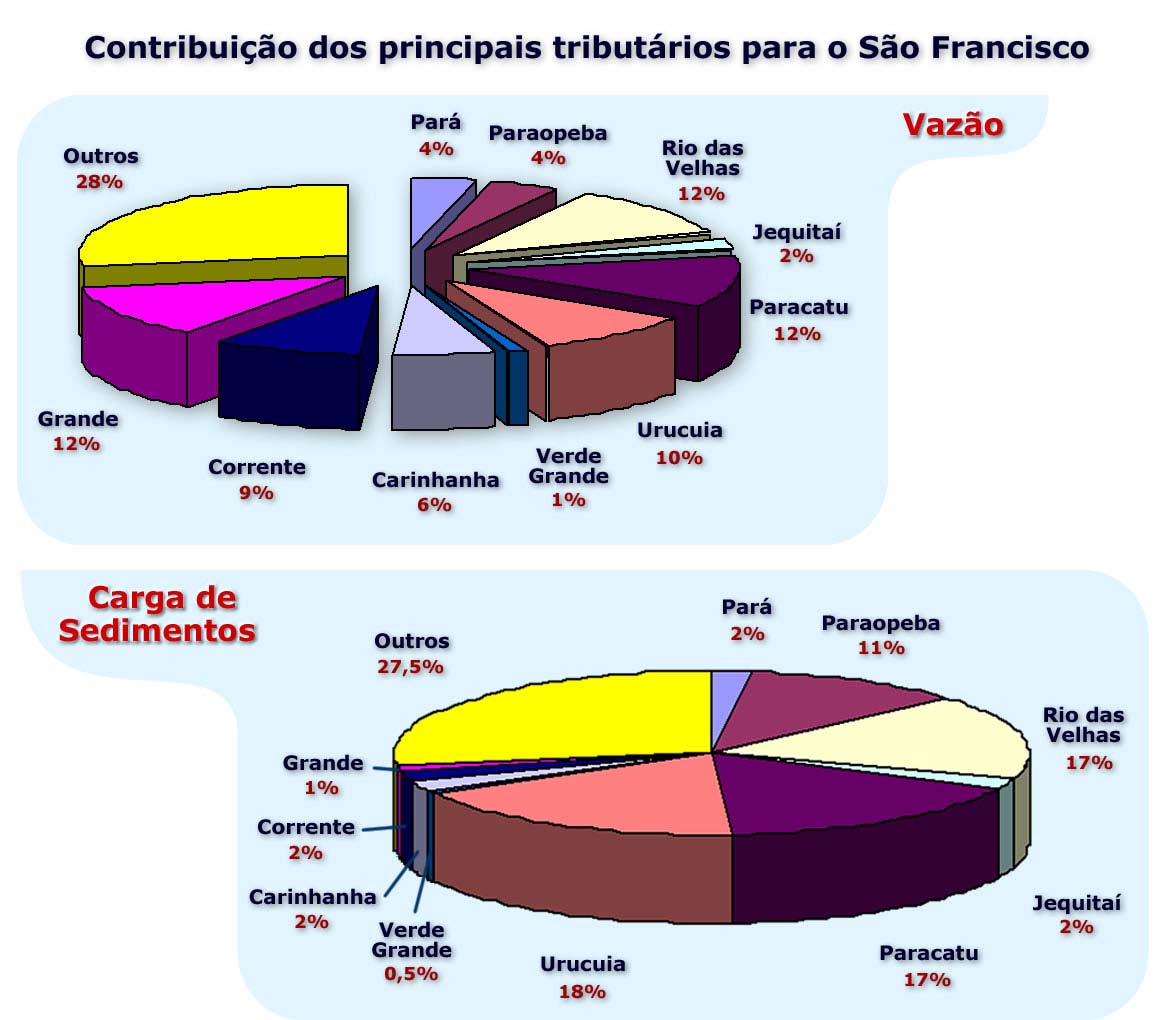
The contribution of sediments from the tributaries of the SÐo Francisco is variable and it is not
necessarily related to the contribution for the rate of flow. As it can be seen in Figure 26, riv-
ers like the Paraopeba, das Velhas, Paracatu and Urucuia present a larger contribution for the
load of sediments than for the rate of flow.
On the other side, the rivers ParÃ, Verde Grande, Carinhanha, Corrente and Grande, that join-
tly contribute with 32% of the rate of flow of the SÐo Francisco, are responsible for only 7,5%
of the load of sediments.
Figura 26. Relation between the contribution to the rate of flow and to the load of sedi-
ments from the main tributaries of the SÐo Francisco River.
3.2 Average Declivity of the Rio SÐo Francisco River
Declivity is one of the factors that interfere both in the production as well as on he deposition
of sediments. The higher is the declivity, the higher the tendency of erosion of the riverbanks
and the transport capacity of sediments. With the reduction of declivity, there is a tendency to
the accumulation of sediments and the latter silting up of the riverbanks.
In the SÐo Francisco River, declivity presents four distinct behaviors, as it can be seen in
Chart 8.
xvi
Chart 8. Average declivity of the SÐo Francisco River
Course
Distance (km)
Declivity (m/km)
From the headwaters / Paraopeba
475
0,70
Paraopeba / Pirapora
268
0,20
Pirapora / Santa Maria da Boa Vista
1.312
0,10
Santa Maria da Boa Vista / Itaparica
192
0,23
Itaparica / Piranhas
252
1,60
Piranha / mouth of the river
185
0,50
3.3 Resume of the Sedimentologic Diagnosis of the SÐo Francisco River Basin
The Sedimentologic Diagnosis was conducted in 1998 and the results reached are still valid.
This study had as its general aim the investigation of sedimentologic aspects of the SÐo Fran-
cisco River Basin, due to the problems of erosion and sedimentation occurred on the riverbeds
of the contributors of the basin, specially the SÐo Francisco River itself.
The results showed that the transport of the loads of sediments on the chute of the SÐo Fran-
cisco River does not present a continuous and constant in relation to the liquid discharge (rate
of flow), despite it being the most relevant parameter, followed by relief, transport and depo-
sition of sediments on the chute of the river.
There is also a dependency on the kind of soil, type and intensity of the vegetal covering, the
area of draining, and also interferences with other factor such as irregular transport (carrying)
of soil by the torrents, the existence of anthropic activity of degradation potential, as defores-
tation for agricultural activities and mineral exploration.
The conclusions and recommendations presented on the diagnosis are, in general terms, that
the production of sediment on the SÐo Francisco river basin is small, but the sub-basins of the
Upper-Course (Paraopeba, Indaià and das Velhas) present an undesirable degradation that, de-
spite the fact that it is not alarming, is considerable.
The diagnosis recommends the adoption of measures aiming to combat erosion, both in its
specific as well as in its general character, with the objective of complementing and empha-
sizing the measures proposed by the Interministerial Commission on Flood Control, created
by Decree n¤ 83.567, on 06/12/1979.
Among several recommendation of specific character, it can be cited the complementation of
the inventory of reservoirs, the aerial photogrametric studies to detect the deforested areas and
the spots of erosion, the implementation and operation of the sedimentometric network, stud-
ies of erosion and silting up of the course of the Low SÐo Francisco.
Some of the general character recommendations are: the creation of regulation which may
control the exploitation of the reminiscent forests neighboring the basin, the creation of na-
tional parks, deeper studies on the causes and risks of erosion on the Upper Course; incentives
to re-forestment with native and fruit-bearing as well as foraging species with the objective of
reaching the ecological balance of the Basin.
xvii
4.
TOPOGRAPHIC CHARTS, SATELLITE IMAGES AND TOPO-
HYDROGRAPHIC CHARTS
4.1 Topographic
Charts
In order to cover the whole area of the chute of the Middle course of the SÐo Francisco River,
it was used 47 topographic charts from the Division of Topographic Service of the Brazilian
Army and from the Brazilian Institute of Geography and Statistics Ù IBGE, on a scale of
1:100.000.
The information on the roads system, hydrograph, marking points, as well as the whole
nomenclature related to these items were extracted from the topographic charts in original
format provided by CODEVASF and updated based on satellite images.
4.2 Satellite
images
In order to cover the whole study area with recent images and with the largest possible resolu-
tion, it was opted the use of images produced by the sensor ASTER, from satellite TERRA. It
was used the composition RGB/123, where vegetation appears in tones of green and the soil
in tones of magenta.
The water of the River will present a color that will depend of the load of sediments, varying
from deep blue, when the amount of sediments is small, to magenta, when the load is large.
4.3 Topo-Hidrographic
Charts
It was used, as reference of the most ancient images, the topographic charts of the SÐo Fran-
cisco River on a 1:5.000 scale, available at Codevasf. These chats have been produced on the
forties, between the years of 1946 and 1948, by the Cruzeiro do Sul Aerophotogrametric Ser-
vices C.O, as requested by the 10th District of the National Department of Ports, Rivers and
Channels, that belonged to the former Ministry of Roads and Construction.
This study covered the channel of the SÐo Francisco River and its surroundings from the city
of Pirapora (MG) to the city of Petrolãndia (PE) and had the objective of generating a detailed
database of the area to provide the base for forthcoming projects of artificial reservoirs and
systems of irrigation.
The topo-hidrographic covering of the SÐo Francisco River counted with a total amount of
1034 charts positioned on the chute of the river and its flooded plain, with each chart covering
an area of 10 km2 (4 km x 2,5 km).
5. DEFINITION OF CARTOGRAPHIC PARAMETERS AND PROCESSING OF
SATELLITE IMAGES AND OF THE TOPO-HIDROGRAPHIC CHARTS
5.1 Definition of Cartographic Parameters
The cartographic parameters are the same used on the mapping for the regions of Upper
(Codevasf, 1996) and Sub-Middle SÐo Francisco (Project GEF SÐo Francisco, 2000), so that
the parametric standardization of the whole SÐo Francisco River Basin is obtained.
In this fashion, it remains the system of Universal Transverse projection of Mercator, Datum
Horizontal Cµrrego Alegre, Datum Vertical MarÕgrafo de Imbituba (SC) and Ellipsoid of
International reference from 1924. The maps produced are compatible with the scale
1:25.000. The minimum dimension mapped is superior to 0,025 km2.
xviii
5.2 Satellite
Images
Processing
5.2.1 Characteristics of the TERRA/ASTER System
The images produced by the sensor ASTER (Advanced Space borne Thermal Emission and
Reflection Radiometer Ù), from satellite TERRA, present a spatial resolution that varies from
15 m (bands of near infrared) to 90 m (bands of thermal infrared) and spectral resolution of 14
bands.
On the present study, it was used the bands 1, 2 and 3, which provide the best conjunct of in-
formation for the analysis of the conformation of the River.
5.2.2 Geometric Correction and Georeference
The process of geometric correction and georeference consists in adjust the systems of digital
coordinates of the image (matrix pixel-line) to a determinate system of cartographic
projection. Therefore, the fashions represented in the images are positioned according to the
geodesic controls previously defined by the user.
5.2.3 Linear Contrast Enhancement
The contrast of an image is the measure of the scattering of the levels of gray that occur in it.
The more scattered the levels of gray along the histogram, the larger the contrast and the
better the visualization of the forms.
5.2.4 Colored
compostitions
Another stage in the process of image preparation for the latter interpretation is the
combination of the original bands in colored compositions. In this process, the six available
bands can be combined in groups of three. In function of the objectives of this study, it was
used bands 1, 2 and 3 in a composition where band 2 was associated to channel R (red), band
3 to channel G (green) and band 1 to channel B (blue), which technically is called
composition RGB/231.
5.3 Processing of Topo-Hidrographic Charts
Due to the antiquity of the maps, the available information regarding its confection are limited
in what concerns both its mapping methodology (air survey, restitution, field support, etc) as
well as the establishing of parameters used in the cartographic projection.
For this reason, the processing of these maps has gone through some additional stages like
electronic digitalization and "re-georeference" of the charts in relation to the cartographic
base established for the study. All stages of processing are described as follows.
5.3.1 Remounting of Index-Map
Since the original map did not allowed the visualization of the path of the river, it was pro-
vided its digitalization and dismembering into parts.
This remounting was done based on the geographic coordinate noted on the map itself. This
process was performed for each distinct course of the index-map until the complete sequence
was obtained.
From this remounted index-map, it was performed the initial ordination of the charts and its
positioning in relation to the geographic bases of reference, so that the selection of charts to
be used could be done.
5.3.2 Selection of the Charts
From the total heap composed by more than 1034 charts, it was selected those which recov-
ered the study area, corresponding to the whole middle Course, spreading until the beginning
the sub-Middle course, where it has been analysed the area of the backwater of the Sobrad-
xix
inho reservoir, compounding a total of 920 charts (sheets comprehended between the numbers
100 and 1020, according to the original enumeration).
Beside this selection, within the previously defined area, it was used only the charts localized
on the chute of the River and its surroundings, which reduced the number to 810 charts.
5.3.3 Electronic
Digitalization
In this stage, the original maps, available in semi-transparent paper, were digitalized using a
scanner LDW-500. Tests were performed to define the best format for the digitalization, tak-
ing into account the size of the generated files.
Based on these tests it was opted to use images in black and white (1 bit) in the TIFF format
(Tagged Image File Format) with Pack bits compactation and resolution of 200 dpi (dots per
inch). The scanner was adjusted on 25% for brightness, which offered good results for the ma-
jority of the charts.
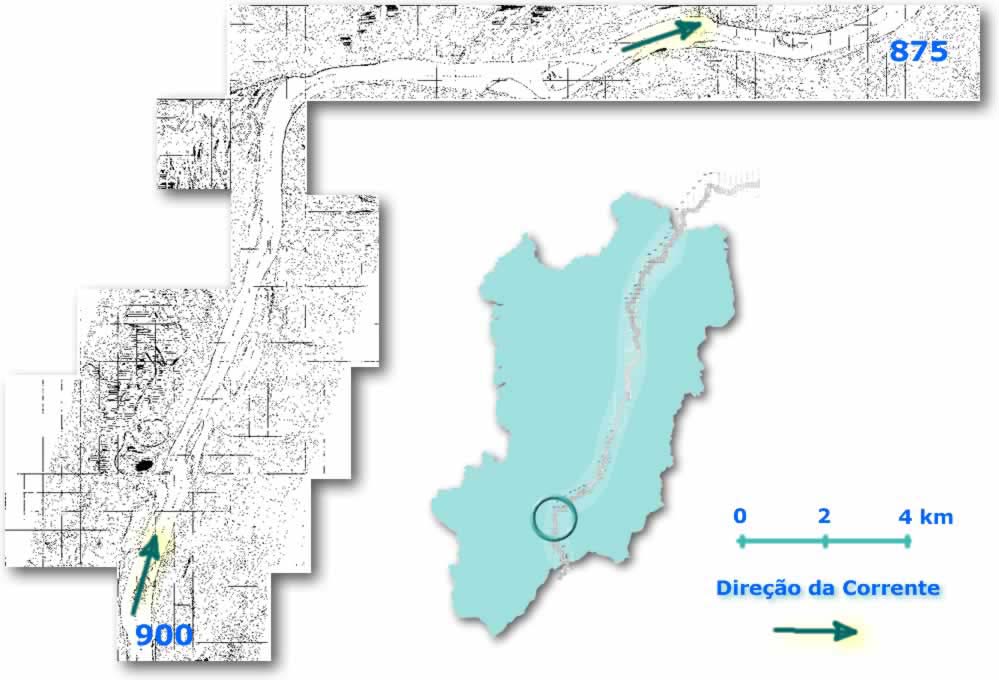
5.3.4 Georreference and Mosaicing of the Charts
It was conducted an initial georeference based on the original coordinates existing on the
charts. Based on this georeference it was possible alto to correct the distortions originated in
the process of electronic digitalization.
The georeferred chart was cut to present only the mapped area (useful area) that would be
used in the mosaics.
With the georeferred and cut charts, the mosaics were set up on groups of 25 charts, so that
they would be compatible with the charts of reference.
Figure 43. Mosaic of the topo-hidrographic charts 875 to 900
6. DEFINITION OF THE MAPPING MODULES
In order to evaluate a variation in the conformation of the chute of the SÐo Francisco River on
the studied course, it was opted the use of mapping modules which positioning aimed the best
possible distribution for the covering of the chute of the river.
xx
However, aiming to keep a compatibility of size between the generated maps and the base
1:25.000 defined by IBGE, the modules were defined with sizes of 7,5' (seven minutes and a
half), which corresponds approximately to 13 km of the terrain. As it is depicted on Figure 48,
with these dimensions it was necessary 73 modules to cover the whole study area.
Using the area defined for each module and the georeferred satellite images, it was performed
the cut of the area referent to the module. For this cut it was used coordinates UTM compati-
ble with the cartographic projection chosen, obtained from the conversion of the values of the
geographic coordinates used in the definition of the modules.
The mosaics obtained for the topo-hydrographic charts have gone through a second process of
georeferring, this time in order to adequate them to the cartographic projection chosen for this
study, compatible with the one of the images. From this mosaic it was obtained the digital
maps that corresponded to the area of the modules.
xxi
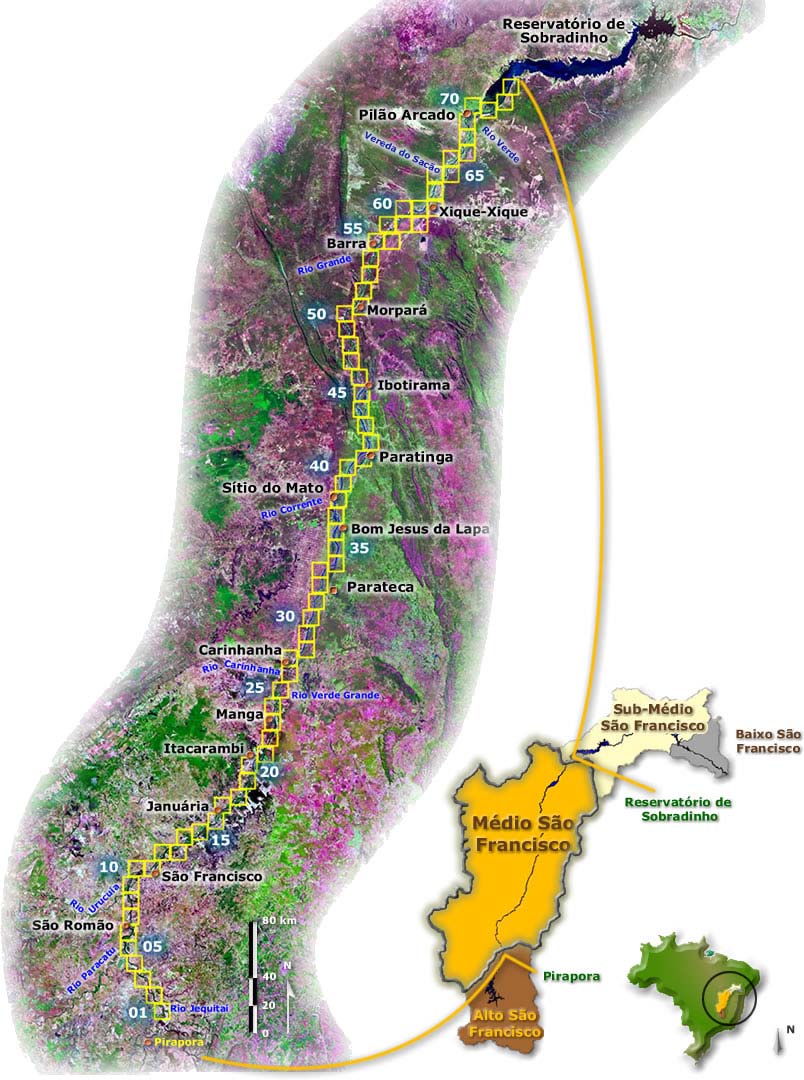
Figure 48. Distribution of the mapping modules over the study area.
Figure 52 shows module 27, where it can be seen the city of Manga. It can be noticed that the-
re was a great expansion of the city area and the agricultural activity has been intensified, and
it can be seen several central pivots close to the left margin of the river, on south of Manga,
besides of an intense agricultural use in all the right margin.
xxii
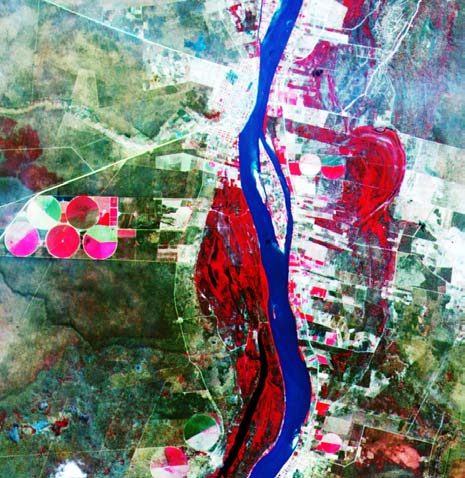
Figure 53. Digital map and satellite image for module 23, where it can be seen the city of
Manga.
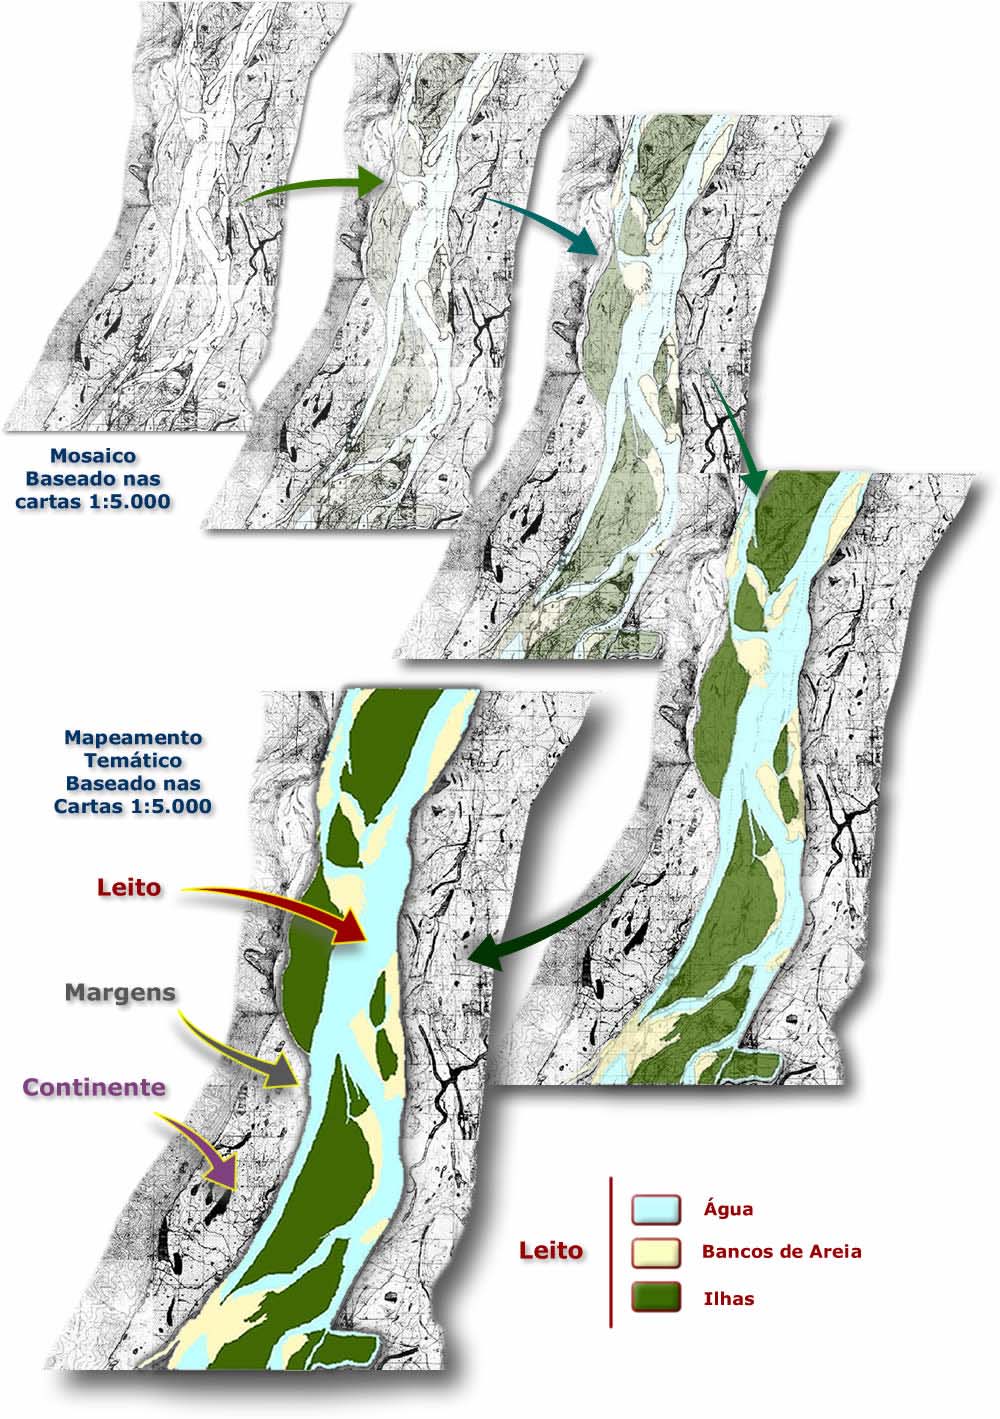
7. INTERPRETATION OF THE RIVERBED CONFORMATION
7.1 Obtaining of the Conformation of the Riverbed using Topo-Hidrographic charts
The maps referent to each obtained module from the topo-hidrographics charts were visually
interpreted in a system of geographic information, generating closed areas (technically called
polygons) with numerical indicators, which show the type of cartographic element that they
refer to.
Accordingly, firm land or the continent, water, the sand banks and islands were delimited and
identified. The conjunct represented by water, sand banks and islands forms the riverbed for
the analyzed day, and the contact of the riverbed with firm land or continent defines the river-
banks. The process is depicted on Figure 57, which presents Module 63 as an example.
7.2 Obtaining of the Conformation of the Riverbed using satellite images
Using georeferred satellite images for each module and following the same procedure de-
scribed on the topo-hidrographicas charts, it has been performed the visual interpretation
through a system of geographic information, generating then the classes water, sand banks
and islands, which gathered compound the riverbed for the most recent date, and, similarly,
through the confront of this riverbed and firm land, it was possible to define the riverbanks.
8. CROSSING OF THE CONFORMATION OF THE RIVERBED FOR THE TWO
ANALYSES DATES
After the obtaining of the conformation of the riverbed for both analyzed dates, it is possible
to begin the crossing of information. In order to do that, it was converted the maps coming
from the interpretation described above and that were presented on a vectorial format (where
the conjunct of polygons is described by mathematical formulas and recorded in text format)
to large bars format (a matrix with two lines and columns where each dot has the value of the
class to which it belongs).
xxiii
8.1 Classes Generated by the Crossing
With the data on the bars format it was carried on the crossing of information referent to both
dates, generating 16 new classes, provenient from the probabilities of crossing of each class of
a date with the four classes of the other date.
Figure 57. Definition of the riverbank, riverbeds and the continent for the maps ob-
tained from the topo-hidrographic charts (module 63).
xxiv
Each one of these classes has a meaning, depending of the point of view in question. There-
fore, an area that was an island and has become continent is, at the same time, aggregation of
island to the continent and sedimentation of the riverbank.
As in the present study the analyses has been made through the crossing of the behavior of the
riverbeds and of the islands, several classes present this meaning depending on the point of
view, as it can be seen on Chart 12.
Chart 12. Classes generated b the crossing of information referring to both dates and in-
terpretation of the meaning of the new class in function of the analyzed parameters.
Class generated by crossing
Interpretation of the Meaning
Former Class
Present Class
Behavior of the is-
Behavior of the river-
(the dot was)
(the dot became)
lands
banks
Continent Continent
None
None
Continent
Water
Present riverbed
Erosion
Continent
Island
Accretion
Erosion
Continent
Sand bank
Present riverbed
Erosion
Water
Sand bank
Present riverbed
Maintenance
Water
Water
Present riverbed
Maintenance
Water
Island
Accretion
Maintenance
Sand bank
Island
Accretion
Maintenance
Sand bank
Water
Present riverbed
Maintenance
Sand bank
Sand bank
Present riverbed
Maintenance
Island
Sand bank
Erosion Ù Riverbed
Maintenance
Island
Water
Erosion Ù Riverbed
Maintenance
Island
Island
Maintenance
Maintenance
Island
Continent
Erosion Ù Continent
Sedimentation
Water
Continent None
Sedimentation
Sand bank
Continent None
Sedimentation
Groups of classes used for the implementation of the behavior of the riverbanks
According to Chart 12, the classes obtained with the crossing were re-grouped in 3 groups Ù
erosion, sedimentation and maintenence Ù for the interpretation of the behavior of the river-
banks. Charter 13 presents these three groups with the classes that compound them and its
meaning, besides the dynamic associated to each one of them.
Chart 13. Meaning of the groups in the analysis of the behavior of the riverbeds.
Grouped Classes
Meaning
Associated Dynamic
Erosion
Continent Ù Water
Areas that belonged to the
Are related to the increase of energy or
Continent Ù Sand banks
continent on the first analyzed competence that allows the e erosion of the
Continent Ù Islands
date and that passed to belong riverbanks, adding the area to the riverbeds.
to the riverbed as water, sand They are over evaluated when affected by
bank or island.
rates of flow above average, which aggre-
gate area to the riverbed without the occur-
rence of erosive process.
Sedimentation
Water Ù Continent
Areas that belonged to the ri-
They are associated to the reduction of
Sand banks Ù Continent
verbed as water, sand bank or energy or competence, leading areas of
i l d
th fi t
l
d
th i
b d t fi
th
ti
t Th
xxv
Islands Ù Continent
or islands on the first analyzed the riverbed to fix on the continent. They
date and that have fixed on
are over evaluated when affected by rates
the continent.
of flow below average, which aggregate
area to the continent without the occur-
rence of sedimentation process.
Maintenance
Remaining Classes
Areas that still belonged to the Areas in which the increase or reduction
riverbed on both analyzed pe- of energy may have affected the original
riods, independently of its
conformation, but the areas remained be-
original or present composi-
longing to the riverbed.
tion.
It must be emphasized that the terms erosion and sedimentation have been used in a descrip-
tive fashion, not implying in the specific nature of the occurred process.
Group of Classes used for the interpretation of the behavior of the islands.
Chart 12 shows that, for the analyses of the behavior of the islands, the classes obtained by the
crossing were re-grouped in 4 groups Ù accretion, erosion with aggregation to the riverbed,
erosion with aggregation to the continent and maintenance Ù and the present riverbed was pre-
sented to enhance the behavior of the erosion classes, indicating if the island was added to the
riverbed or the the continent.
Chart 14 presents these four groups with classes that compound them and its meaning, besides
the dynamic associated to each group.
Chart 14. Meaning of the class groups in the analysis of the behavior of the islands.
Grouped Classes
Meaning
Associated Dynamic
Accretion
Continent Ù Islands
Areas that became islands on the It is associated to the reduction of energy or
Water Ù Islands
present date, independently of
competence of transport of sediments and is
being originally part of the conti- over evaluated when affected by rates of
Sand banks Ù Islands
nent, water or sand banks.
flow below average.
Erosion with adding to the riverbed
Islands Ù Sand banks
Areas that are not islands
Areas associated to changes that occurred
Islands Ù Water
anymore and started to belong on the central part of the channel, related to
to the riverbed, being part, at an increase of energy or competence to per-
present, of the water currents form the erosive process. They are over
water or sand banks.
evaluated when affected by rates of flow
above average.
Erosion with adding to the continent
Islands Ù Continent
Areas that are no longer is-
This process affects mainly the marginal
lands and started to belong to islands and is associated to the silting up of
the continent
secondary channel, being linked to energy
reduction. They are over evaluated when
affected by rates of flow below average.
Maintenance
Islands Ù Islands
Areas that remain as islands.
Indicate areas where it occurred the mainte-
nance of the original dynamic. However,
due to the difference in time between the
two dates, a part of these areas corresponds
to new islands that were formed at the same
place of the ancient islands, with changes,
xxvi
but keeping the same type of behavior.
Similarly as the case of the analysis of the riverbanks, the terms accretion, erosion and main-
tenance were used in a descriptive fashion, since differences in the rate of flow may affect the
percentiles found, causing its over evaluation or under valuation, depending on the kind of in-
terference.
8.2 Definition of the Areas which suffered Erosion and Sedimentation on the River-
banks
With the re-grouping of the classes taking into account the behavior of the riverbanks pre-
sented on Chart 13 being applied to the result of the crossing, it is obtained the maps that
highlight the areas where the processes of erosion, sedimentation and maintenance occurred,
accordingly to the premises and conditions previously described.
On figure 59 it can be seen the re-grouping of the classes for module 63, presented as an exam-
ple in the previous figures. The colors used correspon to those on Chart 12.
xxvii
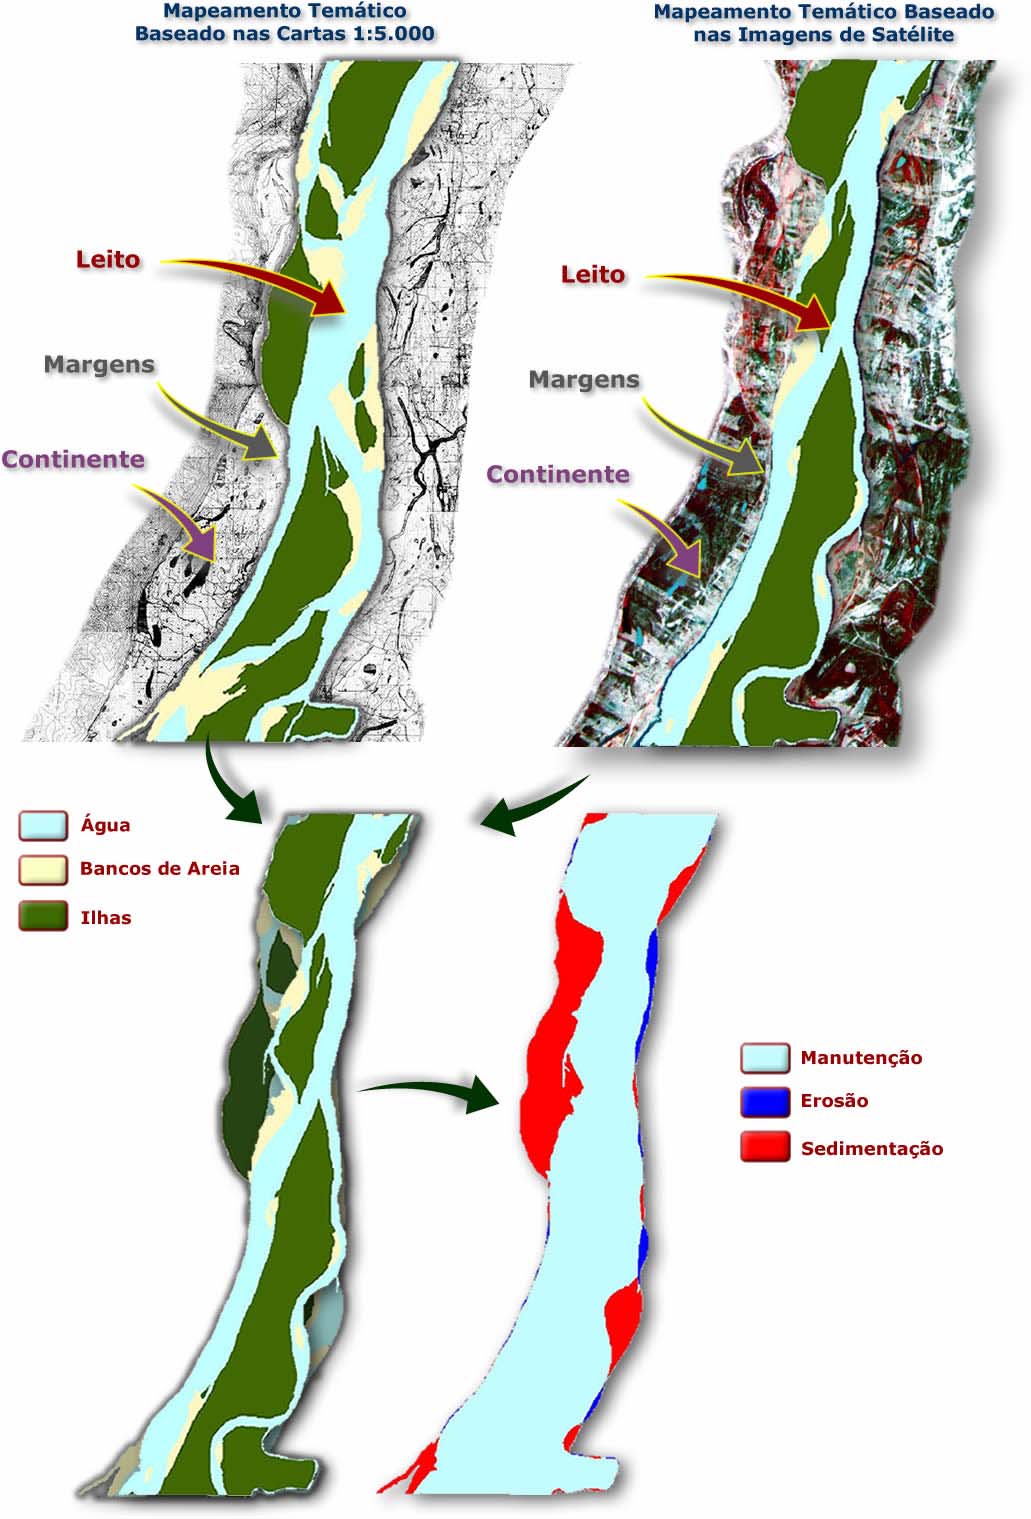
Figure 59. Obtaining of the maps that highlight the maintenance, erosion and sedimen-
tation of the riverbanks.
8.3 Definition of the areas that suffered erosion and accretion of islands
Considering the re-grouping of the classes based on the behavior of the islands on Chart 14, it
can be obtained the maps that highlight the areas where the processes of accretion, erosion
xxviii
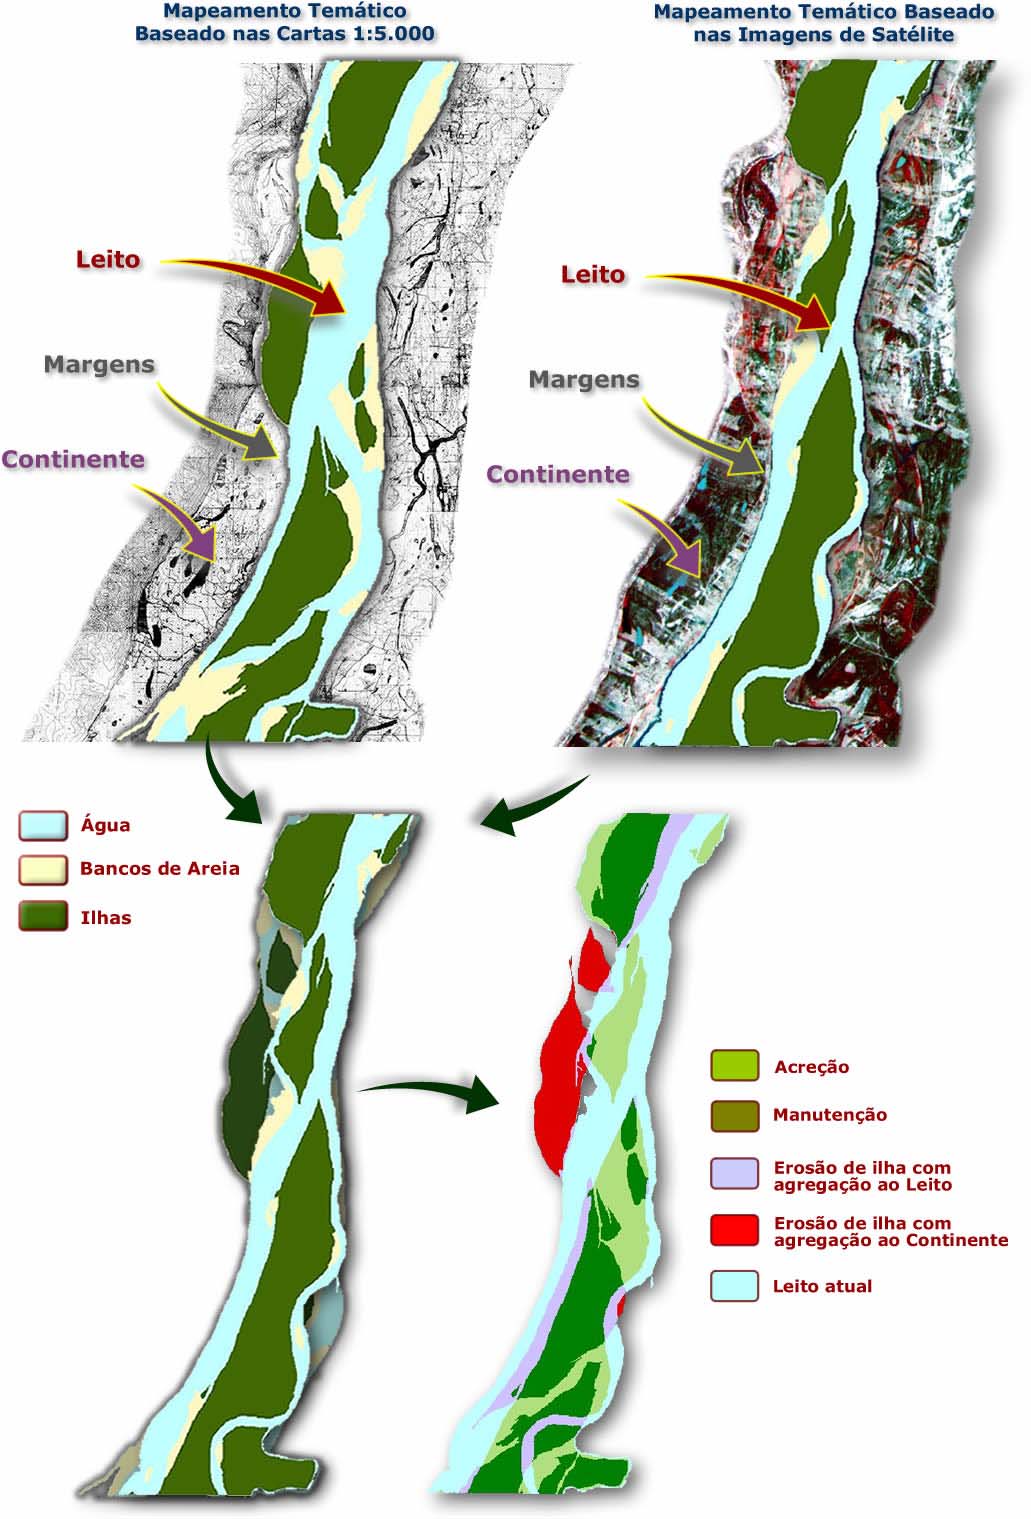
with adding to the riverbed, erosion with adding to the continent and maintenance occurred,
as depicted on Figure 60.
Figure 60. Process of obtaining of the maps that highlight the behavior of the islands in-
dicating where it occurred accretion, maintenance, erosion with adding to the
riverbed and erosion with adding to the continent.
xxix
In this case, the areas that are not part of the process of changing of the islands and that be-
long to the present riverbed were highlighted in bright blue. The remaining colors correspond
to those on Chart 12.
9. PROCESSING OF THE DATA OBTAINED IN THE CROSSING
As it was explained previously, the crossing has generated a conjunct of classes to which the
system of geographic information provides the area and the spatial distribution. The predomi-
nance of a certain kind or conjunct of alterations was observed analyzing the numerical data
obtained as the result of the crossing of classes.
Accordingly, the methodology of analysis followed a process of initial quantification of the
changes, performed using the numerical data obtained through the crossing of information,
followed by the qualification of these changes. This qualification provided the foundation for
the interpretation that takes into account the implications over the dynamic of alteration on the
conformity of the riverbed.
9.1 Reduction of Bias Associated to the Mapping by Modules
In order to perform the visual analysis of the graphic results, it was necessary to apply a pre-
processing over the original values obtained with the objective of reducing the bias associated
to the mapping by modules.
To minimize this interference, it was used a filter applied through mobile weighted average.
This filter attributes to each original value that takes into consideration the interference of the
immediate surroundings. The new values to each module were calculated using a following
formula:
Module X = ((Module X-1)+3*(Module X)+(Module X+1))/5
On the numerical and graphical analysis made module-by-module, it was used the original
data. Therefore, all percentiles cited on the study refer to original data, while the graphics that
present the whole sequence use the data processed by the mobile average.
9.2 Definition of the Parameters for Data Interpretation
In order to be able to analyze the behavior of the islands and of the riverbanks, two parame-
ters were used, based on the original data Ù alteration or the degree of alteration and the bal-
ance. These parameters were chosen because they represent the amount of alterations oc-
curred and the kind of alteration predominant.
The degree of alteration reflects the amount of changes occurred in the area and will be pro-
portional to the size of the area that suffered changes in the analyses modules, independently
of the kind of alteration.
Due to this characteristic, this parameter is not sensible to variation in the rate of flow. It oc-
curs because, in considering the sum of the changes independently of the kind, a reduction of
rate, for example, would decrease the erosion of the riverbanks, but would increase sedimen-
tation, making this parameter not to be very modified. Therefore, it is a trustworthy indicative
of the conjunct of alterations occurred.
As for the balance, it is used exactly as a parameter to indicate the predominance of a certain
kind of alteration, allowing the evaluation of the kind of process that is being more active or if
it is occurring interferences of anomalous rates of flow on the results.
The analysis of the balance showed that the model used to infer the rates of flow was consid-
erably satisfactory, with the obtaining of results compatible with these inferred values.
Besides the degree of the alteration and of the balance, it was analyzed data related to the original
and present composition of the areas that have suffered changes in the period into question. In
xxx
these cases, the graphics always used the original data and not the adjusted by the mobile
weighted average.
10. DEFINITION OF THE COURSES
The large extension of the area associated to differences of behavior of the analyses parame-
ters leaded to the sub-division in courses. As the behavior of the riverbanks and of the islands
was distinct, it was also defined different courses for each analysis.
The definition of the courses used the parameter balance and total alteration. Due to differ-
ences of behavior observed in some of the spots, the defined courses for the islands were not
the same as for those used for the analysis of the behavior of the riverbanks, laying the great-
est differences on the central part of the area.
11. ANALYSIS OF HYDROLOGIC DATA
The differences of rate of flow on both analyzed periods are an important factor in the analy-
sis of the observed changes in the conformation of the riverbed, since they could interfere
with the results obtained. Unfortunately, Codevasf did not have the information on the precise
date of the pictures that served as base for the restitution of the topo-hydrographic charts,
from where it has been extracted the conformation of the riverbed for the first date analyzed Ù
between the years of 1946 and 1948.
Accordingly, it was used average data for the dry season of each year in order to infer the
probable rate of flow of the river. The use of data from the dry season is based not only on the
assumption that this is the most adequate period for the performing of aero surveys, but also
on the pattern of behavior of the features mapped on the charts, which indicated that the rate
of flow of the river was in its dry season average.
11.1 Inferring of the values for rate of flow from the Topo-Hidrographics Charts
In order to have a reference concerning the level of the rate of flow over the period in which
the aerial surveys that generated the charts were conducted, it was analyzed the averages of
the months of July and August of 1946 and 1947. In the year of 1948 there has been a deep
drought that caused the rate of flow to be below average. Therefore it was opted the use of
data related only to the years of 1946 and 1947, which presented levels closer to the general
average rate of that Õpoque.
Using the average rates inferred it was then possible to set up a graphic of the rate of flow for
the area; being defined the average rate of flow and a minimum and maximum base for the
variation of the period.
11.2 Rates of flow for the dates of the images between 2000 and 2001
For the images used on the study, it was available the precise dates, which allowed the calcu-
lation of the rate of flow of the river on the station of measuring. With this information at
hand, it was calculated the rate of flow in each module using a linear interpolation beginning
on the closest station of measurement. In the modules where the station was placed, the rate of
flow was measured, and on the remaining ones, it was calculated.
11.3 Comparison between the rate of flow on both analyzed periods
Figure 70 shows the over position of the calculated and measured rates of flow from the dates
of the satellite images and the inferred rates of flow for the topo-hidrographics charts referring
to the first date analyzed, obtained considering the average of the dry season in the years of
1946 and 1947.
It can be noted that the rate of flow on the present images is, normally, below the inferred rate
of flow for the years of 1946 e 1947, with the exception of the courses where the rate of flow
xxxi
was out of average - between the modules 49 of 52 and from the module 61 on, as cited pre-
viously. In this final course, however, the reservoir of Sobradinho interferes with the effects
of difference of rate of flow, due to the fact that there has been, since 1979, a process of
stabilization of the benchmark due to the influence of the backwaters of the reservoir.
With the exception of the two areas where the rates of flow of the river on the present images
were out of average, it was noted that, in general, there was a tendency that the present rate of
flow remained below average in relation to the rates of flow of the period of reference be-
tween 1946 and 1947.
Figure 70. Comparison between the rates of flow inferred for the months of June to Sep-
tember 1946 and 1947, with rates of flow measured and calculated for the dates of ob-
taining of the images.
This tendency was reflected on the predominance of certain kinds of alteration on the confor-
mation of the riverbed, and due to that, it was analyzed the general behavior of the rate of
flow of the river to verify if this tendency is consonant with the data measured by the fluvi-
ometric station.
To proceed this analysis it was used the average rates of flow obtained in Sobradinho from
1931 to 1999. Figure 71 shows that, as a general tendency, the peaks of the greatest floods are
presenting a reduction, while the years with the greatest droughts depict lower rates of flow.
Figure 71. Average annual rate of flow for the period from 1931 to 1999 in Sobradinho.
xxxii
The tendency line in red over the grapic confirms the observations indicating that it occurred a
reduction of the annual average ratle of flow of 2.800 m3/s in 1931 to 2.500 m3/s in 1999,
which represents a decrease of more than 10%.
On the other hand, the fact that the images show an average rate of flow below the inferred
average for the first date analyzed, as it is demonstrated in Figure 70, is in agreement with the
present condition of the river, and, therefore, reflects faithfully the change in the dynamic of
alteration of the analyzed structures.
It means that the modification occurred in the conformation of the riverbed due to a reduction
in the rate of flow are part of the answer to the new conjunt of variables that is acting.
12. FIELD TESTS
Between August 10th and 11th, 2002 it was performed the field test stage with the objective of
carrying on the visual observation and the photographic register of the areas of the riverbed
and the riverbank of the SÐo Francisco River, on the studied course. In order to do that, it was
conducted a helicopter over flight through the river until a transversal distance of 5km, mostly
through the right margin. The course overflown started in the city of Pirapora, stade of Minas
Gerais, ending in Petrolina, state of Pernambuco, with flying through in the cities of SÐo
Francisco, Bom Jesus da Lapa and Xique-Xique.
13. ANALYSIS OF THE DYMANIC ALTERATION ON THE CONFORMATION OF
THE RIVERBED
The multitemporal evaluation of the dynamic of alteration of the SÐo Francsico riverbed was
conducted based on the analysis of the modifications occurred in the riverbanks (changes on
the riverbed), islands, water surface and sand banks.
Figure 74 shows that the present composition of the classes that formed the riverbed presented
substantial changes on sandbanks, which compounded 13% of the original area and were re-
duced to only 4% of the present area, and on the islands, which represented 20% of the origi-
nal area and now correspond to 28% of the present area
Figure 74. Comparison between the original composition and the present state of the
riverbed, considering the percentages of islands, sand banks and water sur-
faces.
The water surface, on the other hand, presented an irrelevant variation, from 67% of the origi-
nal area to 68% of the present area. The riverbed itself suffered a reduction in its total area
due to the predominance of sedimentation over erosion in its riverbanks, as it can be seen on
the graphic in columns, on the center of the figure above. The behavior of each one of these
classes will be discussed on the following items.
xxxiii
13.1 Behavior of the riverbanks
The alterations on the riverbanks were considered from two basic points of view: erosion and
sedimentation. The areas not affected by the process were classified as maintenance. In figure
75 it is showed, on the right side, the contrast between maintenance, indicated in bright blue,
and the alteration composed by erosion, indicated in dark blue, and sedimentation, indicated
in red.
Due to the nature of the process of evaluation, where the data referent to distinct periods are
compared, it was called erosion of the riverbanks those dots that did not belonged to the river-
bed on the first analyzed period and started to belong in the most recent period, independently
of its present condition (water, sand bank or island) and of the process that lead it to add to the
riverbed.
Sedimentation is constituted by the accumulation of sediments on the riverbanks, leading ar-
eas that formerly belonged to the riverbed to become a definitive part of the continent, con-
sidering the analyzed periods.
The areas that remained belonging to the riverbed, even those that changed their behavior
varying from islands to water current, were considered as maintenance in the analysis of al-
teration of the riverbeds.
The area that corresponds to maintenance (bright blue) and erosion (dark blue) corresponds to
be present area of the riverbed. Gathering maintenance with sedimentation of the riverbeds
(red), it is obtained the original area of the riverbed. On the left side of this figure it can be
seen the balance, where the predominance of sedimentation is indicated in red and the pre-
dominance of erosion in dark blue.
xxxiv
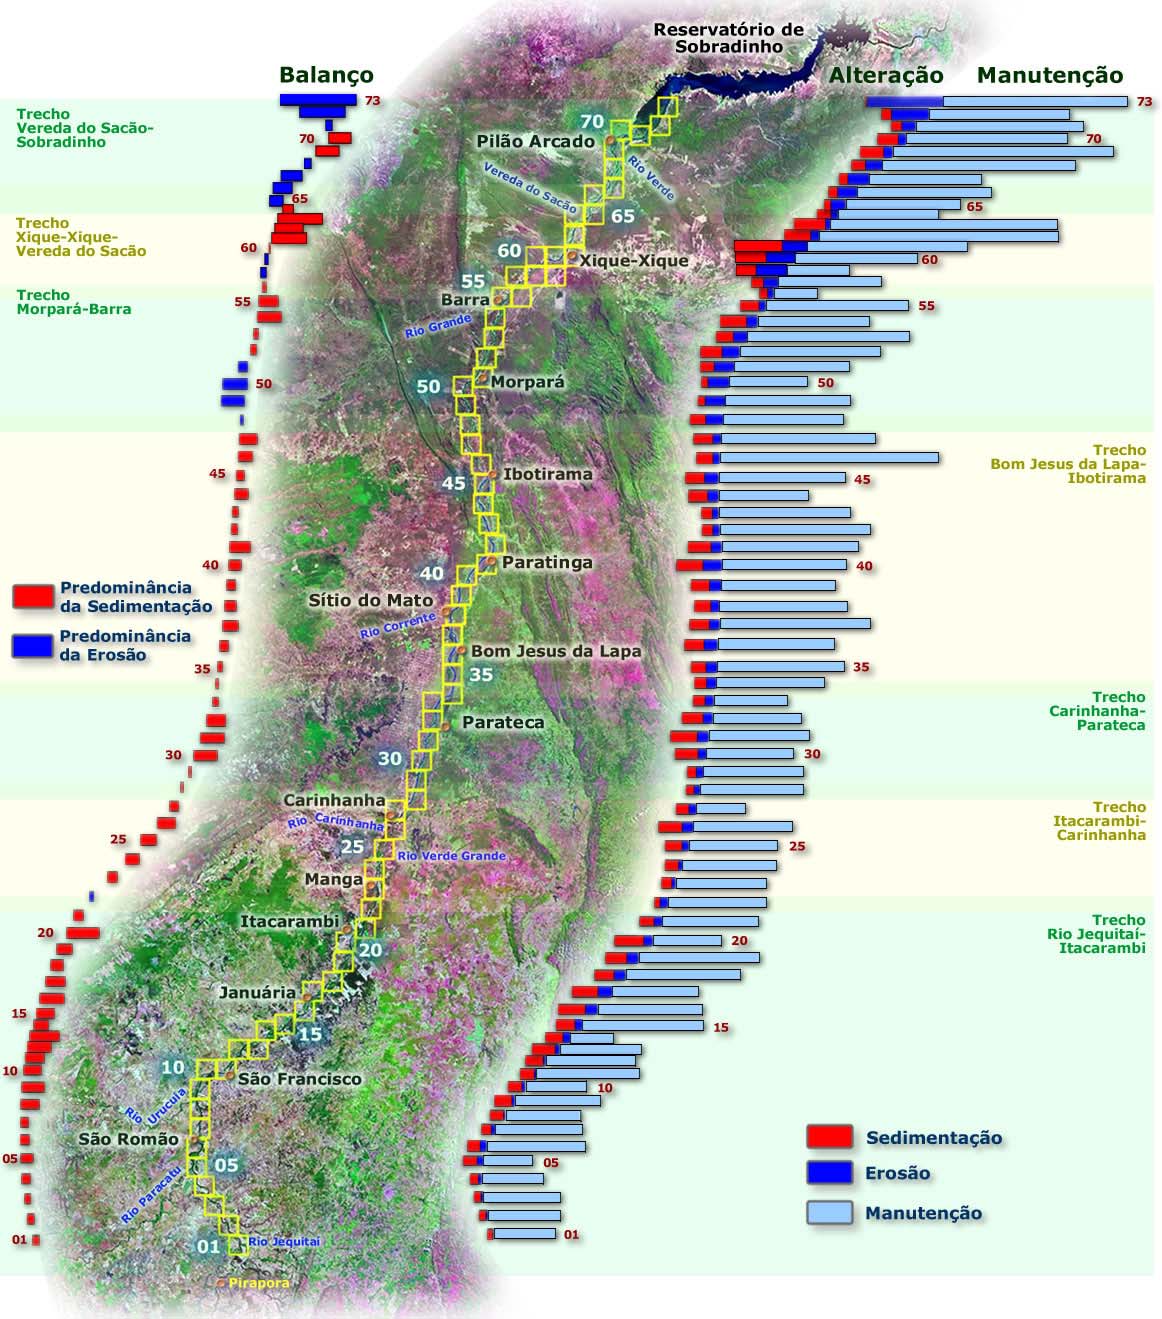
Figure 75. Behavior of erosion and sedimentation on the riverbanks seen through pa-
rameters total alteration and balance. The length of the columns is propor-
tional to the area in km2 of each item.
As it was explained on item 5.1, the parameters total alteration and balance were used to sub-
divide the area in courses, since they do not vary in continuous form along the area studied,
but present alterations between areas with a higher or lower level of alteration or predomi-
nance of one of the events Ù erosion or sedimentation Ù over the other.
For each one of these courses it was carried on a more detailed description. The analysis of
the area in separated courses was also used in order to permit a scale of observation with a
clearer visualization of the results.
13.1.1 Course JequitaÚ River Ù city of Itacarambi
The first course analyzed goes from the mouth of the JequitaÚ River, where module 1 has
been positioned, until the downstream city of Itacarambi, placed on module 22.
xxxv
This course is characterized by the progressive increase of the total alteration with peaks on
modules 5 and 6, close to the mouth of the River Paracatu, 16 and 17, close to JanuÃria, and
module 20, close to Itacarambi, occurring then a reduction downstream towards the city of
Manga.
As for the balance between erosion and segmentation, it occurs the progressive increase of the
predominance of sedimentation over erosion, with peaks on modules 9, 13 and 20, reaching a
maximum on the last one, followed by a deep reduction on the following module and an in-
version on module 22, where predominates the erosion of the riverbanks.
13.1.2 Course Manga-Carinhanha
This course goes from the area upstream from Manga, on module 22, until the upstream of
Cariranha, on module 28. The course is characterized by a progressive growth of the degree of
alteration and by the predominance of sedimentation over erosion from the module 23 until
Cariranha, where the homonymous river draws off, presenting then a reduction on both pa-
rameters.
It can be also observed that sedimentation has been responsible for 65% of the alteration on
the riverbanks in the course, while erosion was responsible for 35%. This corresponds to a
small reduction of sedimentation in relation to the precedent course. This reduction, however,
is more related to the size of the analyzed area (7 modules on this course against 22 on the
precedent one) than to a change of behavior, which also is reflected on the balance of ero-
sion/sedimentation, in which 5% of the area presents predominance of erosion.
13.1.3 Course Carinhanha Ù Parateca
This course goes from the area downstream of Cariranha, on module 28, until downstream of
Parateca, on module 34. The course is characterized by a progressive increase on the total al-
teration of its initial part until module 31, then occurring a reduction until the end of the
course.
Erosion remains in stable levels, always inferior to sedimentation, but presenting values simi-
lar to that category, with the exception of the course between modules 30 and 32, where the
expressive increase of sedimentation is responsible for the increase on total alteration and on
the predominance of sedimentation on the balance.
13.1.4 Course Bom Jesus da Lapa-Ibotirama
This course goes from upstream of Bom Jesus da Lapa, on module 34, until downstream of
the city of Ibotirama, on module 48. It can be observed a progressive increase on the length of
module 41, where there is a sudden reduction followed by an increase on modules 44 and 45,
close to the city of Ibotirama. The sequence is then repeated, with a strong reduction followed
by an increase on the degree of alteration until the end of the course.
The balance between sedimentation and erosion follows the same behavior of the degree of
alteration, since erosion presents a stable behavior while sedimentation is altered, causing dif-
ferences the differences of behavior on both items. However, on the final part of the course,
on module 48, there is an inversion with predominance of erosion over sedimentation.
Figure 93 shows the area of module 45, where is placed the city of Ibotirama. In this module,
the level of alteration is high and the balance erosion-sedimentation tends to equilibrium, with
a slight predominance of sedimentation. The graphics in columns indicates that erosion corre-
sponded to 15% of the original area, a percentage close to the erosion results.
It is noteworthy in this point the alteration of areas that present widening and narrowing of the
channel, which occurs specially due to the changes on the conformation of the islands. The
graphic in slices shows that the areas that are added to the continent were compensated by
xxxvi
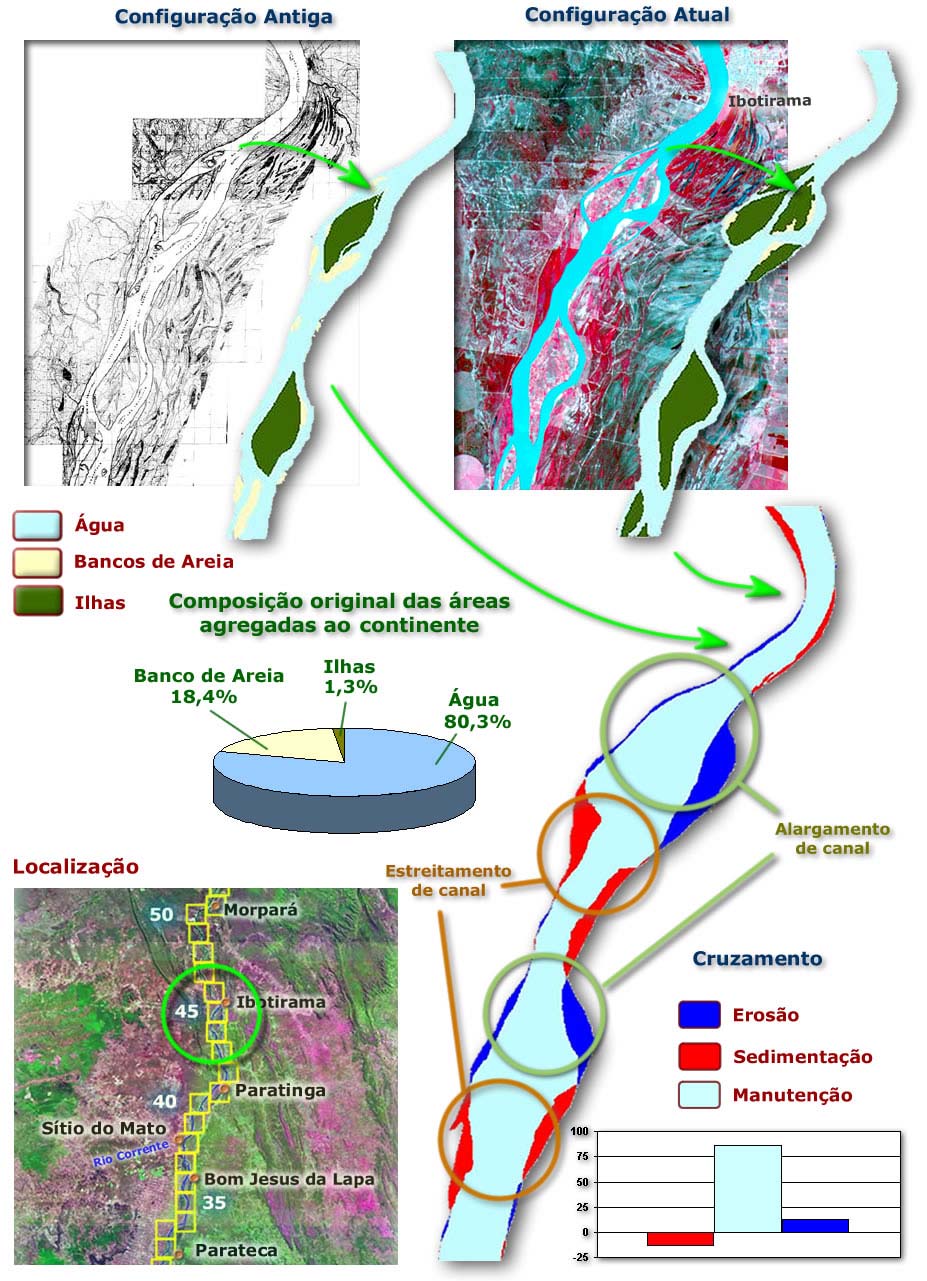
more than 80% of water, 18% of sand banks and a portion larger then 1% of islands. This in-
dicates that the dynamic of alteration on this course was intense, with the greatest part going
through processes of secondary sedimentation before being fixed on the continent.
Figure 93. Area of module 45 with widening and narrowing of alternate channels, with a
slight predominance of sedimentation and high level of altering.
Picture 15 shows the North part of module 45, downstream the city of Ibotirama, where the
riverbed suffered intense modification. It can be noted that the accretion of the island placed
on the left part of the picture forced the erosion of the left riverbank, as indicated. It can be
seen also areas of flooded plains that present scars of ancient riverbeds.
xxxvii
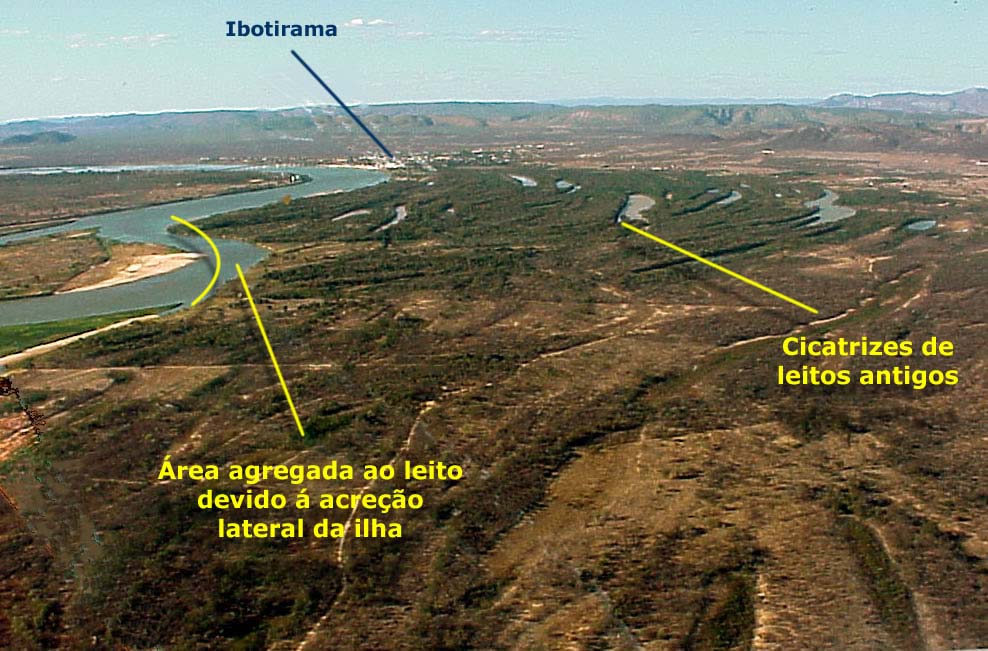
Picture 15. North part of module 45, downstream from Ibotirama,
where it can be seen scars of ancient riverbeds and areas
that suffered erosion on the riverbanks due to the accretion
of islands.
The presence of water in these areas affects the level the adding of particles from the soil,
turning it more susceptible to erosion. Therefore, during the floods, the higher rate of flow
and energy find a greater easiness to cause changes on the conformation of the riverbed in
theses places. This can proved by the high level of altering observed in this module where the
widening and narrowing of the channel occurred due to the action suffered by the areas with
this configuration.
13.1.5 Course MorparÃ-Barra
This course goes from module 48, upstream of MorparÃ, until the city of Barra, placed on
module 56. It is characterized by a predominance of erosion over sedimentation from module
48 until module 51, downstream from MorparÃ, followed of an inversion with the growing
predominance of sedimentation until the city of Barra, on the end of the course. The level of
altering presents a variable behavior, being higher on the initial part and lower on the final
part of the course.
There is a balance between erosion and sedimentation, where the former corresponds to 51%
of the total alteration. The same applies to the balance, where the predominance of erosion
corresponds to 51% of the total analyzed area.
13.1.6 Course Barra-Vereda do SacÐo
This course goes from upstream of the city of Barra, on module 56, until the downstream of
Xique-Xique, close to Vereda do SacÐo, on module 65. It is characterized by an average level
of altering that grown progressively until reaching a peak on module 61, suffering then a pro-
gressive reduction from Xique-Xique on.
Between modules 60 and 61 are found the highest levels of altering of the whole analyzed
area. It is worth bearing in mind that module 59, which covered part of the Gado Bravo is-
land, was not used on the calculation because the mapping on scale 1: 5: 000 did not cover
this area.
This course presents an antagonistic behavior, with the predominance of sedimentation on the
highest levels found on the whole area between modules 61 and 63, associated to the pre-
xxxviii
dominance of erosion on modules 57, 58 and 65. On the general estimate, sedimentation pre-
dominates with 58% of the total altering, while erosion corresponds to 42%.
On the balance, the predominance of sedimentation is higher, reaching 77%, against 23% of
erosion. It occurs because on the points where sedimentation predominated, the difference
was not so relevant as on those where occurred the predominance of sedimentation which, as
has been said before, has reached the highest values for the whole area.
13.1.7 Course Vereda do SacÐo-Sobradinho
This course goes from downstream of Xique-Xique, close to Vereda do SacÐo, on module 65,
until the beginning of the reservoir of Sobradinho, on module 73, the last of the sequence. The
course is characterized by a growing level of alteration that reaches its peak on module 69,
then being reduced until module 71.
As for the erosion of the riverbeds, it is more intense than sedimentation from modules 65 to
69, when an inversion takes place, with predominance of sedimentation on modules 70 and
71. On modules 72 and 73 it can already be felt the interference of the Sobradinho Dam,
which causes an expressive increase of the benchmark which is highlighted by the absolute
predominance of eroded areas, being found on these two modules the largest added areas to
the riverbed in absolute values.
13.1.8 Integrated Analysis of the Alterations on the Riverbeds
Predominance of sedimentation on the riverbanks with reduction of the area of
the riverbed
Figure 109 presents the behavior of the three parameters analysed on the study of the behavior
of the riverbanks: sedimentation, maintenance and erosion. The graphic in columns shows
that 87% of the original area of the riverbed was kept, sedimentation took around 13% of this
area and erosion added around 9% of the riverbed to the continent. Therefore, the present riv-
erbed presents an area 4% smaller than the ancient.
The graphic in slices shows that sedimentation represented 58% of the observed modification
in the area studied, while erosion corresponded to 42%.
Analyzing the behavior of the areas where it occurred sedimentation, as showed on Figure
110, it can be observed that 16% was originally composed by islands that fixed themselves to
the continent due to the silting up of the secondary channel, as demonstrated on the example.
xxxix
Figure 109.
Behavior of the
items nalyzed on
the study.
Figure 110. Original composition of the areas that suffered sedimentation and fixed
themselves on the continent.
xl
Arround 26% was represented by sand banks, in its majority marginal deposits, which fixed
on the continent with vegetal formation. Water represented, for its turn, arround 85% of the
areas that suffered desimentation.
In resume, it can be said that, in the largest part of the area, the obtained results for erosion
and sedimentation of the riverbanks reflected the reduction of rate of flow occurred during the
analyzed period. Between modules 49 and 51 there has been over evaluation of erosion due to
the use of images where the river appeared with a rage of flow above average, affecting the
the definition of the present conformation.
From the module 60 on, the use of images where the river presents a rate of flow bellow aver-
age and a conjunction of factors that include the "delta effect" caused by the proximity of the
Sobradinho Reservoir, the extense inundable plain, the existence of areas that provide sandy
sediments, among others, caused the results to present an irregular behavior, being then nec-
essary to carry out a more detailed study in order to qualify the occurred changes.
Relation between the original compostion of the areas that suffered
sedimentation and the degree of altering
The higher percentage of water on the original composition of the areas added to the continent
is an indicative of the higher amount of processes that occurred so that the adding could take
place. Therefore, this percentage may serve as a parameter to evaluate the necessary amount
of processes for the ancient conformation of the river to reach to present conformation.
It can be noted that this parameter has an inverse relation with the level of altering, since the
more processes were needed to generate a change, the smaller the chance of a change to take
place.
Therefore, the analysis of the original composition of the sedimented areas shoes that the de-
gree of alteration is associated to the kind of change occurred on the area, being higher when
the changes are those occurred in a more direct fashion, as the fixation of an island or a sand
bank to the continent.
As a whole, it can be observed that on the initial part of the river, until the city of Manga, pre-
sents a differentiated behavior, where the higher percentage of water is associated to a higher
level of altering and to the predominance of sedimentation in relation to the following course,
showing that more energy is acting over the riverbanks and depositing the material within its
own course.
Downstream from this point, the courses in which water constituted a lower percentage that
on the course upstream showed an increase on the level of altering. The higher percentage of
islands as original area added to the continent is associated to the level of altering, being this
relation specially clear on the course Xique-Xique-Vereda do SacÐo.
Relation between the alterations observed and the behavior of the watersheds, of
the imundable plains and of the configuration of the riverbed
Figure 113 shows the variation on the conformation of the present riverbed in the whole ana-
lyzed area through illustrative pictures.
In sum, in its initial part, the river present higher competence, because there is a higher gradi-
ent, which increases the potential energy available to cause changes on the conformation of
the riverbed.
However, in this initial part are also found more fit riverbanks and watersheds more defined
and the higher energy only causes intense alterations when propitious areas to this alteration
are found, represented by meadows on the inundable plains where the soil is more susceptible
to changes due to the jeopardy of its structure by excess of water and the watershed of the
river is not perfectly fit.
xli
Due to this, even on this initial part of the river, the areas where there are steep banks and
well-defined watersheds delimit the riverbanks, present changes relatively smaller.
Downstream of Ibotirama, towards the reservoir of Sobradinho, it is observed more intense
changes on conformation. Three factors may help to explain this behavior. Firstly, the areas
with fit watersheds become rarer and, therefore, the river can act easier on its riverbanks.
Secondly, the areas with meadows on the inundable plains become larger, which associated to
less fit watersheds allows extended areas to be flooded during the inundations and, with the
more intense energy, suffer its action. In third place, the decrease of energy contributes to the
increase of sedimentation that occurs both on the riverbanks and on the riverbeds, causing
sedimentation of the riverbanks and accretion of islands in the areas of smaller transport en-
ergy.
This accretion of islands, by its turn, forces the lateral opening of the channel, causing erosion
on the riverbanks where water is forced to follow a new path. Accordingly, the same cause
origins two opposite effects: erosion and sedimentation of the riverbanks, increasing then the
level of total alteration observed.
It is worth mentioning that the region of the reservoir was, on the first analyzed date, an area
of high gradient due to the existence of the Sobradinho Waterfall and, with its inundation, be-
came an area of backwaters.
This sudden change also caused intense alterations on the conformation of the river, and, as
per what can be observed on the graphics, this interference seams to be acting from down-
stream of Barra, on module 58, being intensified from Xique-Xique on, at module 65.
xlii
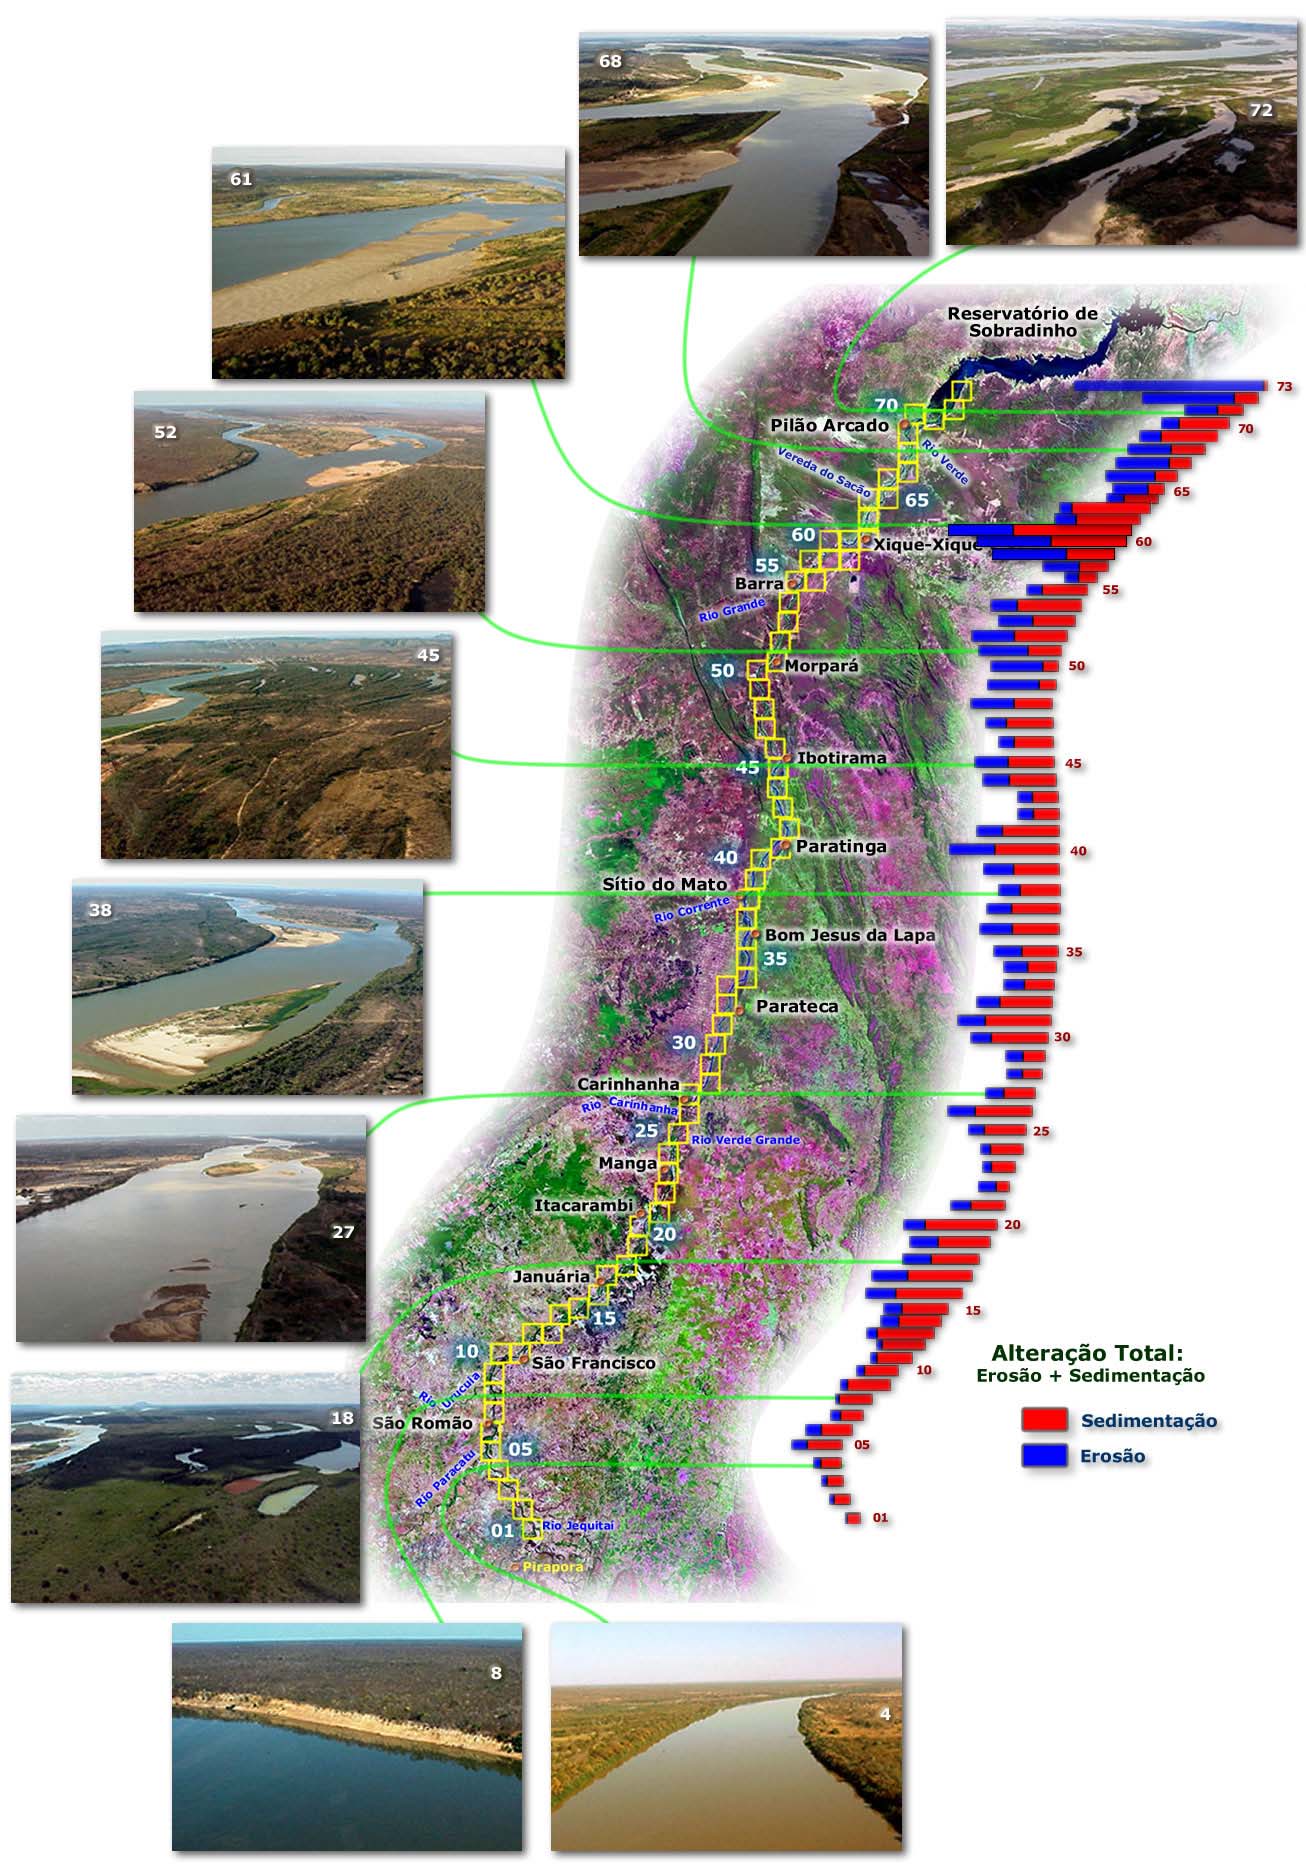
Figure 113. Variation on the conformation of the riverbed, of the watersheds and of the
inundable plains.
xliii
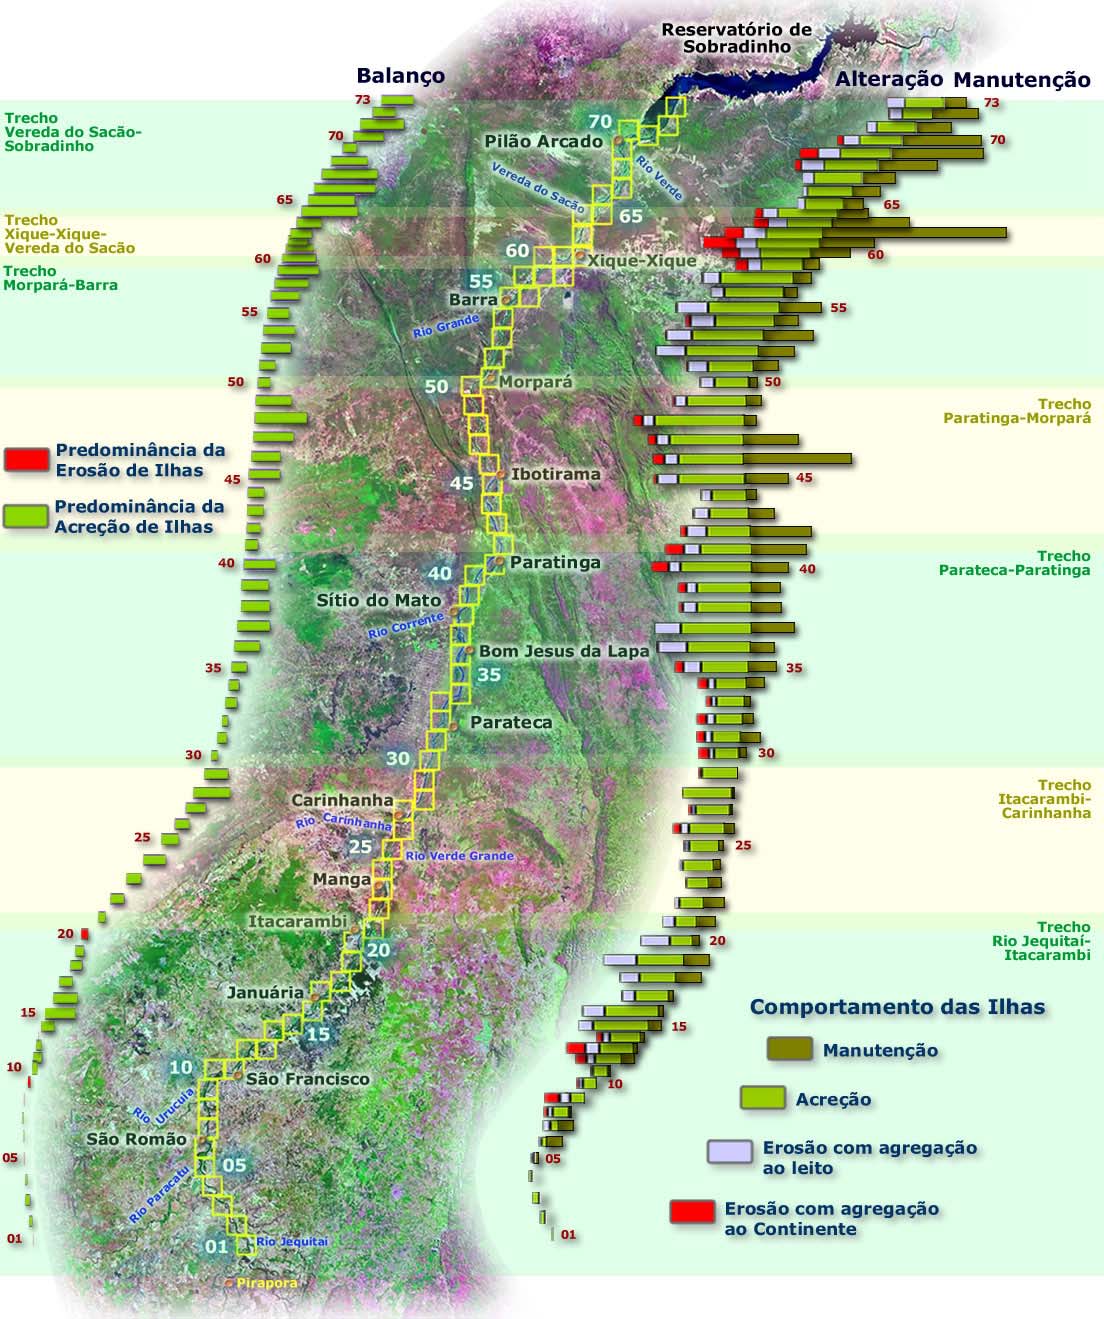
13.2 Behavior of the islands
It has been called accretion of islands the aggregation of material to already existing new is-
lands, having this accretion occurred with the advance over areas of water current. Erosion, on
the other hand, was represented by the loss of areas that were originally islands. In this case, it
was opted to differentiate the losses to the water current and to the continent.
Similarly to the analysis of the riverbanks, the process of regrouping of the classes in order to
identify and quantify the alterations on the conformation of the islands was applied to the 72
modules of mapping, being then calculated the areas of each on of the four analyzed items.
This process was followed by the graphic analysis of obtained data using two parameters: to-
tal alteration, represented by the sum of erosion with accretion, and the balance, represented
by the difference between them, as it can be seen on Figure 114.
Figure 114. Behavior of erosion and accretion of the riverbanks, using the parameters
total alteration and balance. The length of the columns is proportional to
xliv
the area in km2 of each item.
As it was described on the chapter referent to methodology, the behavior of these two parame-
ters was used to define courses where the area was analyzed. These courses differ slightly
from those used for the analysis of the riverbanks, because the alterations occurred on the is-
lands have been placed on a different fashion, therefore, they were focused in distinct con-
juncts.
In the figure is also presented the area of maintenance of the islands, on the right side, in
bright green. Gathering this area to the correspondent in accretion, indicated in bright green,
we obtain the present area of the islands.
If it is made the association with the areas correspondent to erosion with adding to the conti-
nent and with adding the riverbed, we then have the ancient area of the islands in each mod-
ule. The balance is presented on the left side of the figure and highlights the areas where ac-
cretion predominated (in bright green) and those where erosion predominated (in red).
13.2.1 Course JequitaÚ River-Itacarambi
This course goes from the mouth of the JequitaÚ River, on module 1, until downstream from
Itacarambi, on module 21. In it occurs the predominance of accretion of islands over erosion,
with the exception of modules 9 and 20, where erosion outweighs accretion.
As for total alteration, it also presents a tendency of growing from the beginning of the course
with peaks on modules 09, 13, 15, 16 and 19, with reduction from this point on. Between SÐo
Francisco and Janºaria it is observed a predominance of fixation of islands to the continent in
relation to loss for the water current.
Figure 116 presents module 5, which presented only the formation of a small island in the
present conformation, and on the ancient conformation they were completely missing.
On this module is placed the mouth of Paracatu River, which is showed on Picture 25. It can
be observed that on the day when the picture was taken (08/10/2002) the SÐo Francisco River
presented a level of sediments higher the Paracatu, which is evidenced by the difference of the
color of the waters, that presents a green tone on the Paracatu and a brown one on the SÐo
Francisco.
However, the level of sediments of both rivers is variable, since on Figure 116, it is the Para-
catu River that presents a brigther color, indicating that it contains a higher amount of sedi-
ments on suspension.
The larger contribution of sediments of the Paracatu River to the SÐo Franscisco River seams
to be the usual, despite of the situation presented on the picture, since downstream of its mou-
th, the sediments brought by the Paracatu River form sand banks and a small island, as it can
be seen both on the satellite image and on Picture 26.
On this last one it can also be seen that the water from the Paracatu River does not mix imme-
diately with the SÐo Francisco oneÇs and flows mostly close to the left riverbank, where the
sediments brought are being accumulated, forming sand banks and a small island. It can also
be seen that the small occurance of islands or its absolute missing (which occurs from module
1 to 7), is associated to a specific channel conformation, with the riverbed fit and watersheds
well defined.
13.2.2 Course Itacarambi-Carinhanha
This course goes from downstream of the city of Itacarambi, on module 21, until upstream of
Parateca, on module 30. It is characterized by the progressive increase of predominance of
xlv
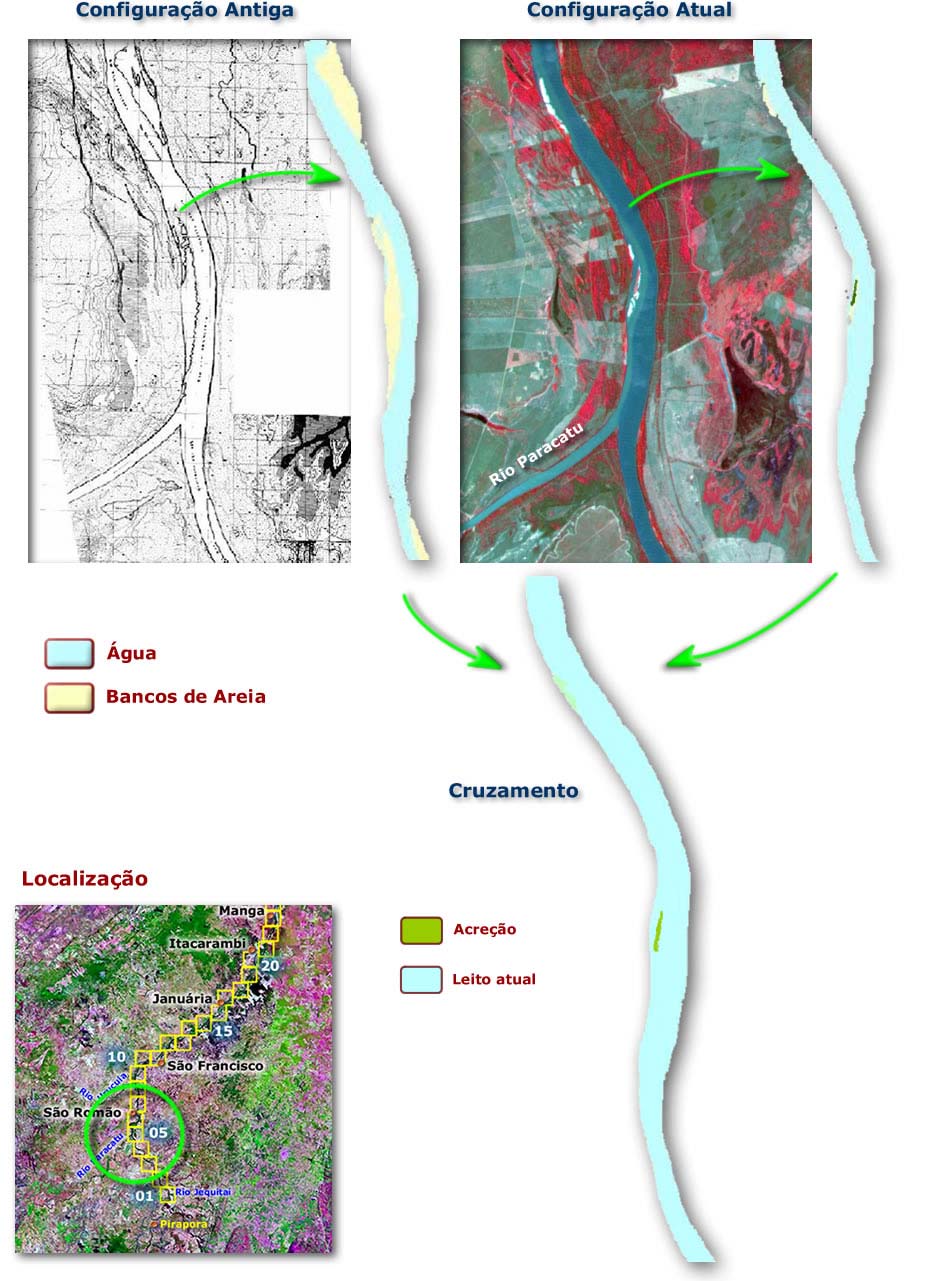
accretion of islands with a peak close to Cariranha, on module 28, then occurring a reduction
until the end of the course.
On the mouth of the Cariranha River (module 26) it can be observed a predominance of ero-
sion with loss to the continent, which is repeated on module 30. On the remaining modules
generally occurs loss the riverbed.
xlvi
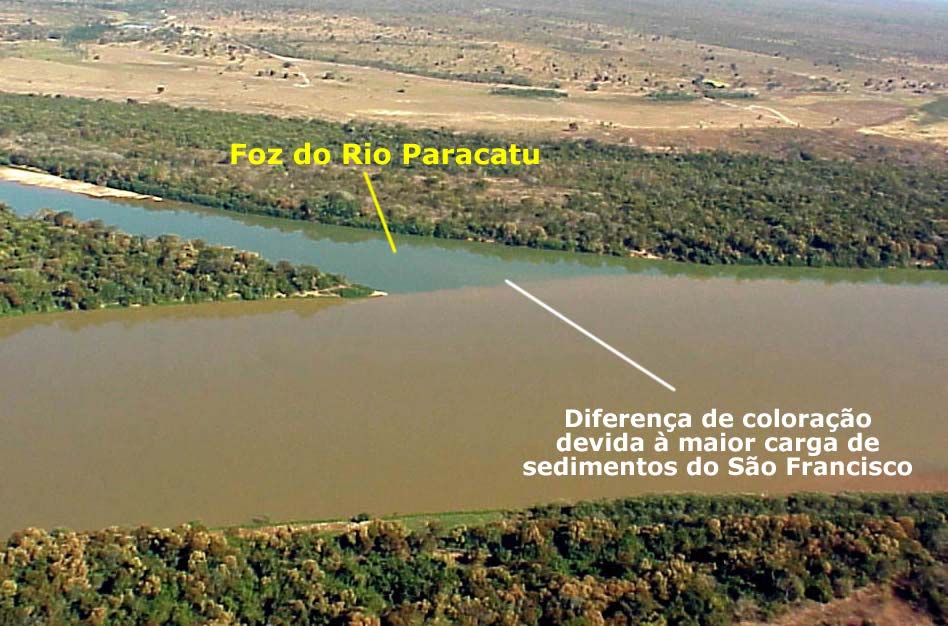
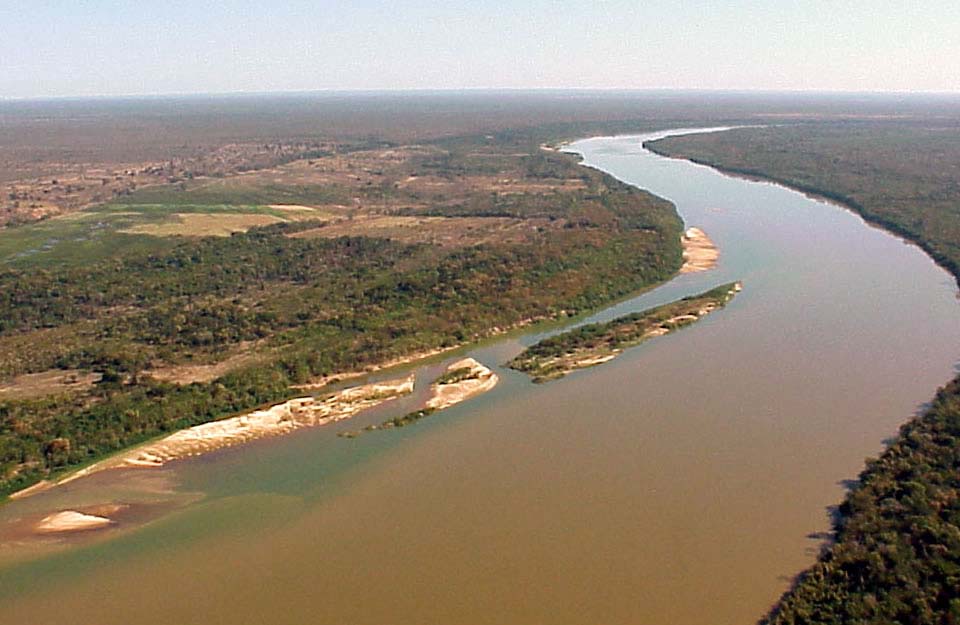
Figure 116. Area of module 5, where occurred only the appearance of a small island on
the central part of the module.
Picture 25.
Mouth of the
Paracatu river on
the SÐo Francsico
River, where it can
be observed the
difference on the
color of the water,
which is associated
to a larger amount
of sediments on the
SÐo Francsico, at
the date when the
picture was taken.
(08/10/2002).
Picture 26.
Sand banks and
island formed
downstream to the
mouth of Paracatu
River, due to the
sediments brought
by this river and
deposited on the
SÐo Francisco. It
can be also ob-
served the river-
bed fit with water-
sheds well defined.
13.2.3 Course ParatecaÙParatinga
This course goes from upstream of Parateca, on module 30, until downstream of Paratinga, on
module 41. On this course it can be seen a progressive increase of predominance of accretion
of islands over erosion, with peaks on modules 37 and 40.
The total alteration presents a very similar behavior, highlighting the fact that only on mod-
ules 36 and 37 it did not occurred the loss of islands to the continent.
Erosion of islands with adding to the area of the riverbed corresponded to 19% of the total al-
teration, which also represents a meaningful increase in relation to the previous course, where
this percentile reached 10%. Accretion corresponded to 66% of the total alteration, consider-
ing that on the previous course it was above 80%. Therefore, on this course there is a higher
level of alteration with a more effective contribution of island erosion.
xlvii
13.2.4 Course Paratinga-MorparÃ
This course goes from Paratinga, on module 41, until upstream of MorparÃ, on module 50.It
is characterized, like the previous ones, by a progressive increase on the predominance of ac-
cretion over erosion, reaching a peak on module 48, then being reduced until the end of the
module.
The total alteration presents a value on the beginning of the course, followed by a reduction
until module 44, with a progressive increase on module 45 until module 48, where the behav-
ior for the balance is repeated, with reduction until the end of the module.
13.2.5 Course MorparÃ-Xique-Xique
This course goes from upstream of MorparÃ, on module 50, until upstream of Xique-Xique,
on module 58 (bearing in mind that module 59 was not used on the multitemporal analysis)
On this course the accretion of islands prevails, with a progressive increase until module 53,
where there is a reduction and the behavior is repeated with a peak in module 57.
Total alteration also presents a growing behavior with peaks on modules 52, 55 and 58. Ac-
cording to the graphic in slices, 4% of total alteration was represented by erosion of islands
with aggregation to the continent, around 26% by erosion with aggregation to the riverbed and
around 70% by accretion. In relation to the previous course, there was a reduction in erosion
with aggregation to the continent and an increase in erosion with aggregation to the riverbed
as well as in accretion.
13.2.6 Course Xique-Xique-Vereda do SacÐo
This course goes from upstream of Xique-Xique, on module 58 (module 59 was not used on
temporal analysis), until module 65, where Vereda do SacÐo draws off on the SÐo Francisco
River.
The most important characteristic of this course is the high level of alteration associated to a
relevant accretion of islands to the continent. According to the graphic, the erosion of islands
with aggregation o the continent corresponds to 18% of total alteration. Erosion with aggrega-
tion o the riverbed corresponds to 21%, while 61% refers to accretion. These percentiles show
that erosion with aggregation to the continent represents 45% of the erosion observed on the
course. This percentile varied between 15% and 30% on the previous courses.
Figure 140 presents module 64 where an important predominance of accretion occurred,
which according to the graphic in columns, corresponded to more than 200% of the original
area. Erosion, which corresponded to 30% of the original area, occurred with aggregation to
the riverbed.
The graphic in slices shows that only 2% of the area that has become island belonged origi-
nally to the continent, around 63% were composed of water and around 35% were sand banks.
Picture 38 shows an area on the final part of module 64 where the conformation was totally
modified with the appearance of new islands, as indicated. This part of the river is bordered
on the left by a sandy terrain that limits the inundable plain of the river.
xlviii
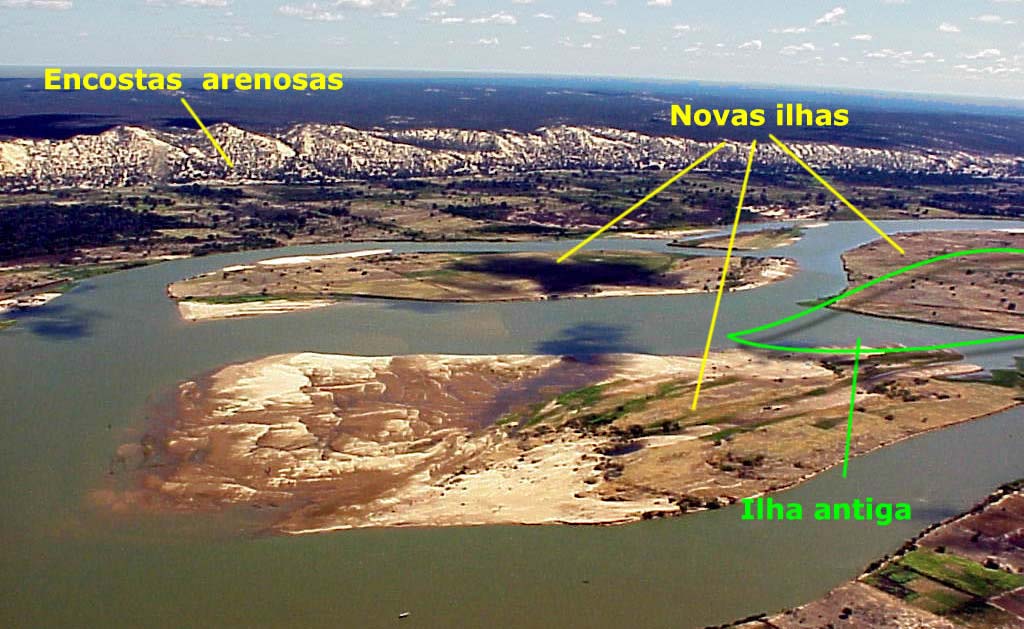
Picture 38. Islands that appeared on the final part of module 64.
Despite the low cohesion, characteristic of sandy terrain, these slopes are considerably stable,
considering that the maps from the forties show that their outline is quite similar the to present
one. Vegetation plays a fundamental role on the maintenance of this stability and the preser-
vation of the original covering of this area is very important to avoid an additional carrying of
sandy sediments to the river.
xlix
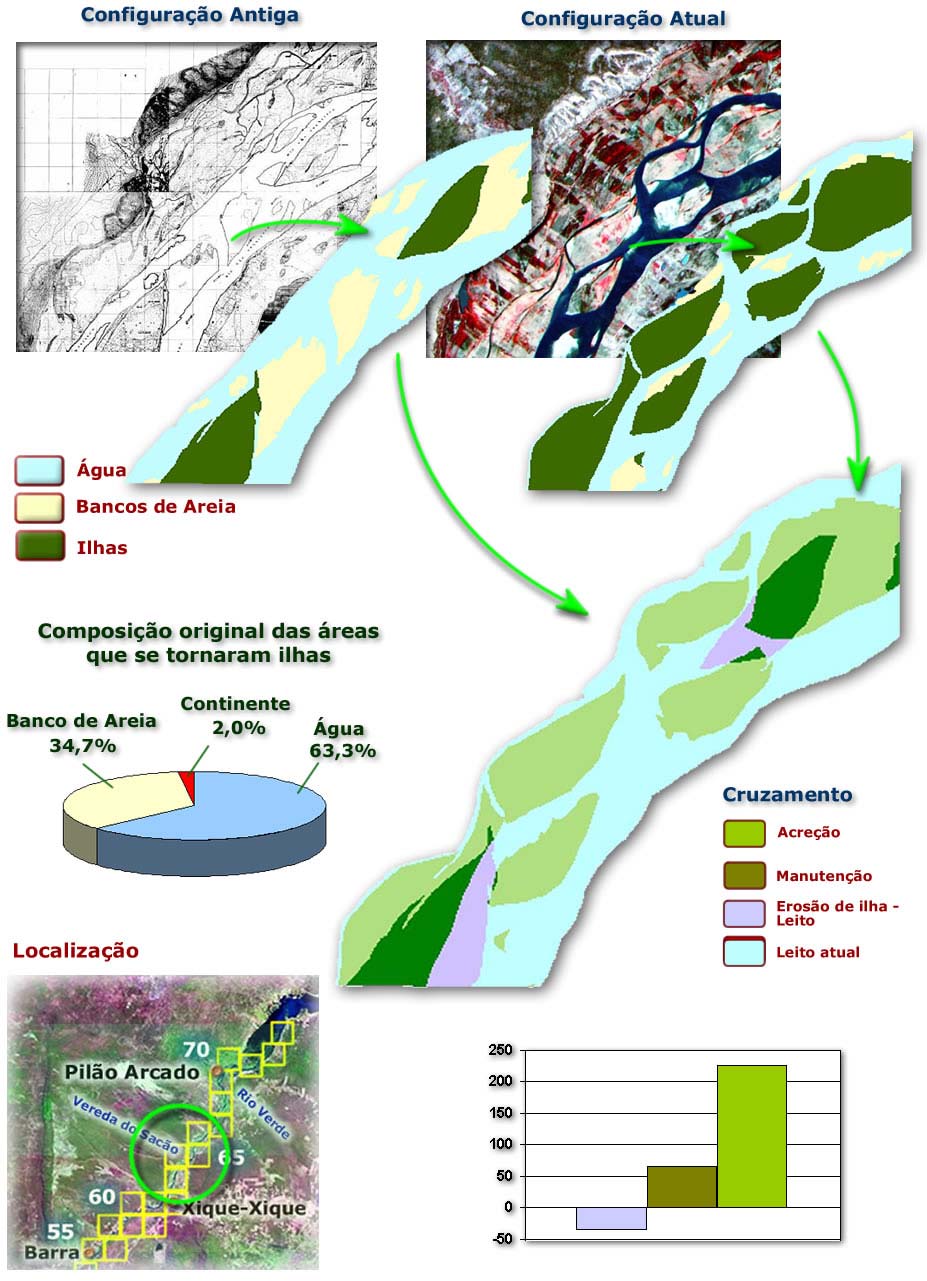
Figure 140. Area of module 64, where occurred the predominance of accretion of is-
lands.
13.2.7 Course Vereda do SacÐo-Sobradinho
This course goes from the mouth of Vereda do SacÐo, on module 64, until the beginning of
the Sobradinho reservoir, where module 73 was placed. On this course there is a tendency of
l
reduction of the predominance of accretion of the islands, reaching a minimum level on mod-
ule 69.
Total alteration, that presents a peak on the beginning of the course, on module 64 (described
on the previous course) is reduced on module 65, starting to increase progressively until mod-
ule 69, where it draws off on the Verde River. From this point on it starts to decrease until
module 72. On module 73, where it occurs an increase of the islands, the changes of the con-
formation are associated to the influence of the Sobradinho reservoir and therefore were not
considered for the values presented on the graphics.
13.2.8 Integrated analysis of alteration on the islands
Generalized accretion to the islands
The graph in columns presented on Figure 146 shows that around 70% of the original areas of
the islands were kept. We should keep in mind that, due to the interval of almost 50 years be-
tween the two dates, in many courses the islands suffered a total modification on their con-
formation, with the surge of new islands in the place of former ones.
In this case, area in common of the former and present islands was computed as maintenance,
being the percentile over evaluated, while the percentile of accretion, which is of 64%, was
under estimated.
Figure 146.
Behavior of
the items ana-
lysed on the
study of be-
havior of is-
lands.
As to erosion it can be noticed that the areas that used to be islands and that have integrated
themselves to the continent correspond to 9% of the original area, while 21 % has aggregated
to the riverbed, adding up to a total of 30%. Thus the current island area is 34% bigger than
that of the first analyzed date, which conforms quite a relevant percentage, even if factors
such as differences in the rate of flow and benchmark between the two dates are taken into
consideration.
Considering only the modifications that took place, the sliced graph shows that accretion cor-
responded to 68% of the aggregate data, erosion accompanied by aggregation to the riverbed
corresponded to 22% and erosion with aggregation to the continent to 10%.
li
Figure 147 shows the original composition of the areas that became islands. Sandbanks repre-
sented 23% of the total and constitute areas that already possessed features of deposition
zones in the first date and that could have consolidated as islands through the evolution of the
fixation process due to the development of vegetation and to the accretion along its margins
Figure 147. Original Composition of Areas that Became Islands.
In opposition to the areas that used to be sandbanks, which already had indications of deposi-
tion zones, the areas that originally belonged to the continent or to the water surface have nec-
essarily gone through additional modification steps before consolidating as islands.
The areas that belonged to the continent and which correspond to around 4% of the current is-
lands have necessarily gone through the process of agreggation to the riverbed, something that
may have occurred with the formation of a secondary channel or with the erosion of the mar-
gins accompanied by sedimentation.
The areas formerly composed by water and which correspond to around 73% of the current
islands have gone through a process of sedimentation and posterior fixation as islands. In
module 73, where areas of the continent were aggregated to the riverbed as islands due the
flooding associated to the Sobradinho reservoir, were not included in these data.
To sum it up, the behavior of the islands shows that the tendency of accretion has been pre-
dominant in the entire area, having occurred even in those sections where the different rates of
flow could have compensated for this effect. This indicates that the process of accretion of the
islands is more persistent and coherent, and that it suffers less interference from factors such
as differences in benchmark.
lii
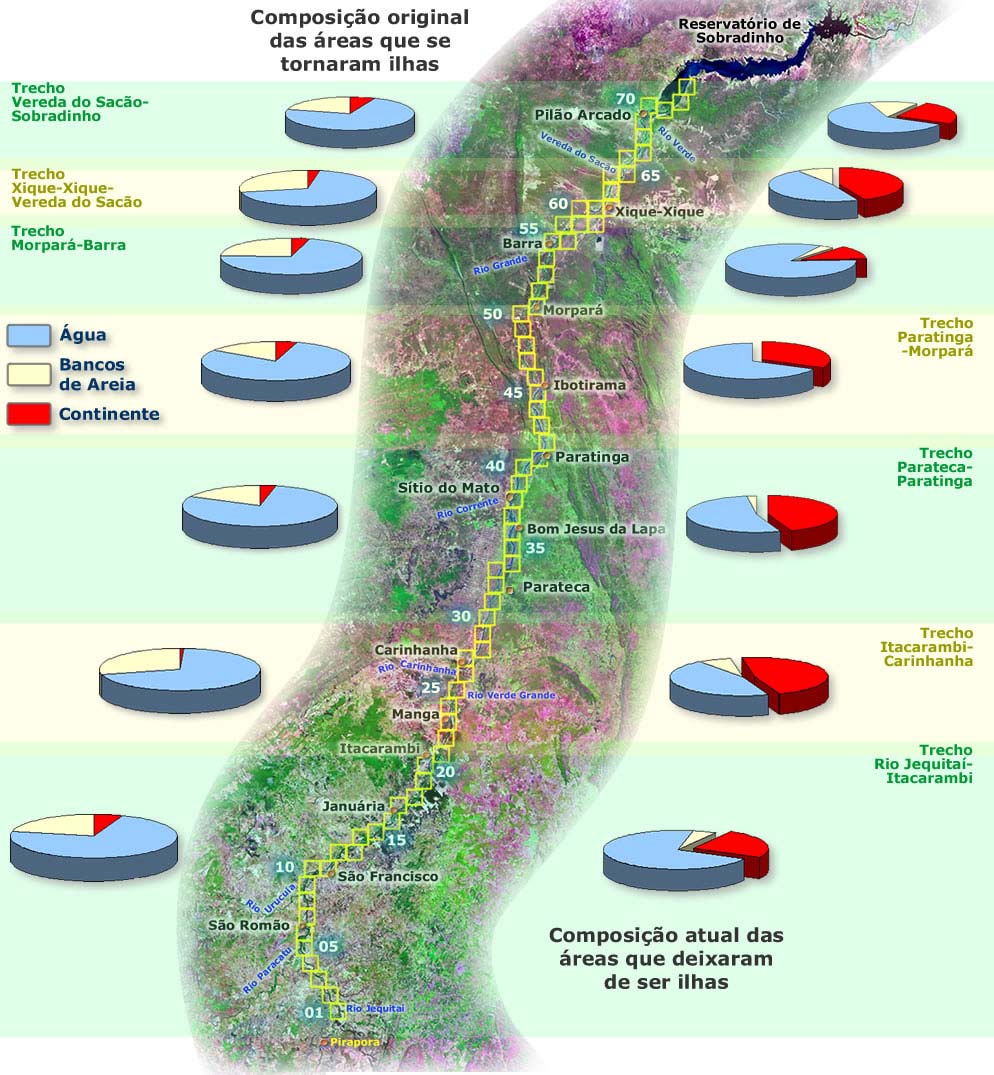
This process has caused a 34% increase in the island area, and the more relevant changes were
observed in areas where the riverbed presents a bigger flooding plain and the less relevant
changes took place where the riverbed is more enclosed.
The interference of the "delta effect" caused by proximity to Sobradinho and the different re-
sponses of islands located near the margins and those located in the central portion of the riv-
erbed have affected the behavior of the islands in the final section of the area, something that
makes more detailed studies necessary, along with new mapping that accounts for the distinc-
tion between marginal and central areas.
Analysis of the original and current composition of areas that went through
accretion and erosion of islands
Figure 149 shows, by section, the original composition of the areas that became islands
through the process of accretion and the current composition of areas that used to be islands
and suffered erosion.
Figure 149. Analysis of the current and original composition of areas that suffered, re-
spectively, erosion and accretion of islands for all the courses comprised by
liii
the study.
In general, the percentage of islands aggregated to the continent is associated to the process
of alteration of marginal islands, while the erosion with aggregation to the waterflow indicates
the degree of activity in the main portion of the channel.
Thus, through the analysis of Figure 149 one can see that in all analyzed courses the aggrega-
tion of areas to the waterflow predominates, which indicates that there is a predominance of
the alteration process in the main portion of the channel.
However, in the Itacarambi-Carinhanha course (the second of the sequence, in the down-
stream direction), in the Parateca-Paratinga course (third of the sequence) and in the Xique-
Xique-Vereda do SacÐo (the last but one of the sequence), the percentages approach a bal-
ance, with areas aggregated to the continent mounting to between 40% and 48%, which indi-
cates that the modifications on the marginal islands were relevant in these areas.
Specifically in the Xique-Xique-Vereda do SacÐocourse, the aggregation of islands to the con-
tinent was relevant not only in terms of percentage of the total area, but also in absolute terms,
once this section has presented the greatest degree of modification of islands in the entire ana-
lyzed area. The below-average rate of flow of the river in the image may have intensified this
effect, something that will be further discussed in the concluding chapter.
However, the same image was used in the Vereda do SacÐo-Sobradinho course and these re-
sults were not found, maybe due to the influence of the reservoir, which prevents the bench-
mark from suffering variations so intensely with the changes in the rate of flow..
Relationship between the modifications in the islands and the behavior of the
riverbed, of the slopes and of the flooding plains
Figure 150 presents the relationship between the observed modifications in the islands, indi-
cated by the graph in columns that present accretion and erosion for each module, and the
conformation of the riverbed, of the slopes and of the flooding plains shown by the set of il-
lustrative pictures which account for the entire analyzed area.
In sum, it was observed that the islands of the initial portion of the course are narrow and
long, in accordance with the tendency defined by the enclosed slopes and the semi-rectilinear
riverbed.
In the central portion of the area the river presents more curves and widens, which allows for
the formation of bigger and more irregularly-shaped islands, generally in the central portion
of the riverbed, once the slopes are well enclosed.
From Ibotirama downstream the river continues with its process of riverbed widening, with
less enclosed slopes and progressively bigger flooding plains, features associated to wider is-
lands, with irregular shapes, generally associated to sandbanks and to greater occurrence of
marginal islands.
At the end of the course this process intensifies, which characterizes an anastomosification of
the riverbed, with islands conforming side by side, which forces the appearance of several
channels. The marginal islands become more common and the sandbanks associate them-
selves both to the islands as with the margins, indicatin an intense process of sedimentation.
These observations about the end portion of the course add up to the references to the "delta
effect" noticed when approaching the backwaters of the Sobradinho reservoir, with a signifi-
cant reduction of energy and a generalized process of sedimentation, as if the river were draw-
ing off at its mouth.
liv

13.3 Comportamento do Espelho d'êgua
A anÃlise do comportamento do espelho d'Ãgua durante o perÚodo analisado demonstrou que
seu comportamento nÐo seguiu o que ocorreu com as ilhas e bancos de areia.
Figure 150. Variations of the shape of islands, slopes and of the flooding plains
lv
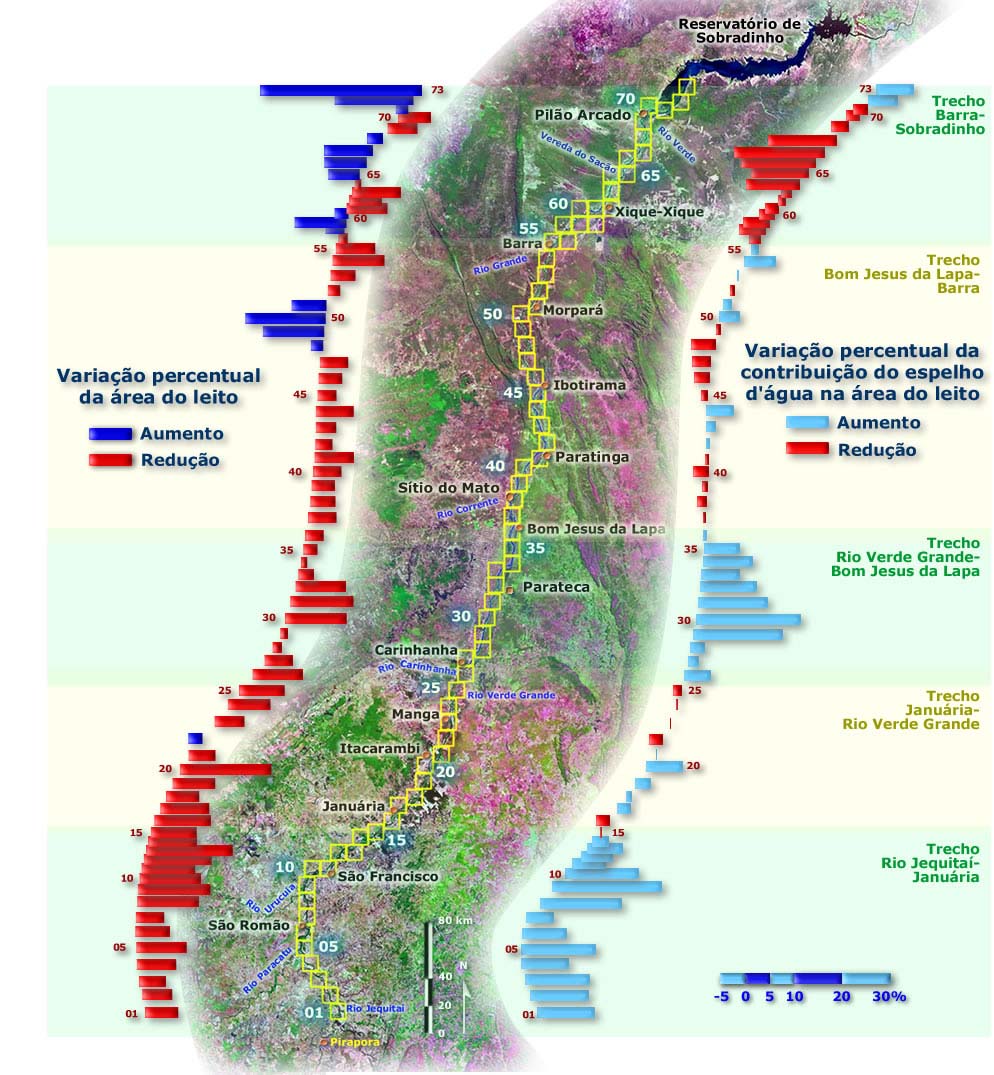
This variation, nevertheless, when analyzed module by module, shows a specific behavior
with indications regarding the process of modification of the river. Figure 151 confronts the
percentual variation of water in the composition of the riverbed with the percentual reduction
of the riverbed area for each module.
Figure 151. Percentual variation of the riverbed area and of the contribution to the wa-
ter surface for the entire analyzed area.
In this figure the curses have been defined to facilitate the understanding of the processes that
are occurring in the analyzed area. It is necessary to recall the fact that the water surface has
not presented a significant variation in the percentage of the total riverbed area is due to the
compensation that occurs between the JequitaÚ Rivermouth-Barra course (where the percent-
age of water increases sharply or presents an equilibrium) and the Barra-Sobradinho Reser-
voir course, where the redution of the percentage of the water surface in the composition of
the riverbed predominates.
lvi
The increase in the percentage of water is significant in twocourses. In the first, denominated
JequitaÚ River-JanuÃria, the percentage of water has increased by an average of 10% to 20%
in relation to the riverbed area. On the other hand, the riverbed presented a similar reduction
in its area, due to the predominance of sedimentation over erosion of the margins.
In the Verde Grande River-Bom Jesus da Lapacourse, the same behavior is observed, being
the riverbed reduction less expressive. This behavior may indicate that the river is shallower
due to the increase of bottom load, which forces the water to spread over a wider area. This
may also explain the reduction of sandbanks which originally were in the surface and that are
currently part of this bottom load.
Two other sections present a behavior in which the percentage of water is nearer equilibrium,
some times with a slight increase, others with a slight reduction. In the first of those, denomi-
nated JanuÃria-Verde Grande River, the riverbed also suffers reduction, as in the former case.
In the Bom Jesus da Lapa-Barra course there is also a near-equilibrium percentage of water,
but the riverbed suffers little reduction and, in modules 49 and 50, a significant increase, due
to the influence of the above-average rate of flow in the utilized image.
These differences of behavior indicate that the process of modification is responding to other
variables in this area and that, as a consequence of this, both the riverbed and the percentage
of the water surface are not changing much.
Finally, in the Barra-Sobradinho section, one can find a very different behavior, with a sub-
stantial reduction of the percentage of water, which occurs independently of eventual increase
or reduction of the riverbed area.
It is possible to conclude from Figure 151 that the modifications that occurred in the shape of
the riverbed respond to different variables, depending on the area under scrutiny. While in
some areas it is possible to speculate over a reduction of riverbed depth, in others this does
not explain observed modifications.
In the final course there are clear signs of a delta-like process of silting up, due to the presence
of the Sobradinho reservoir, which causes a reduction of the gradient in the area and in the re-
duction of transport energy downstream the reservoirÇs stillwater.
13.4 Behavior of Sandbanks
The sandbanks have undergone a generalyzed reduction, which occurred practically in the en-
tire area. As demonstrated by the Bar Graph of Figure 152, around 95% of the sandbanks dis-
appeared. On the other hand, new sandbanks sprang up, representing an increase that equals
26% of the areas that originally contained sandbanks at the first analyzed date, while around
5% of the original area remained as it were.
lvii
Figure 152.
Behavior of the
sand banks
The Slice Graph shows that, excluding maintenance and considering only the areas that suf-
fered modification, the reduction corresponded to around 78% of the total, while the increase
was responsible for 22% of the modifications.
Figure 153 shows that, from the areas that ceased from being sandbanks, 51% became water,
26% aggregated to the continent and 23% became islands. The sandbanks that fixated to the
continent were represented originally by marginal deposits, as the example shown in the Fig-
ure highlights.
The sandbanks located inside the channel, as they develop vegetations, become stable and
consolidate as islands, as indicated in the Figure. The sandbanks that became water may be of
both kinds and this change reflects an effective modification in the transport energy.
lviii
Figure 153. Behavior of areas that ceased from being sandbanks.
In conclusion, the sandbanks suffered a steep reduction throughout the period: 69% of the
original area. The consistency of this reduction is shown by the fact that it is independent of
the benchmark, in those sections where the rate of flow presented an anomalous behaviour. In
the final section, the "delta effect" is causing the accumulation of sandbanks, as opposed to
the observed behaviour in the rest of the area, a fact that was highlighted by the below-
average rate of flow in the images used to define current conformation at that spot.
13.5 Sudden variations in the behavior of analyzed parameters associated to widening
and narrowing of the channel
During the analysis of all the parameters under scrutiny, such as the balance and total modifi-
cation for margins and islands and the percentual variation of riverbed and water surface ar-
eas, it has been noticed that sudden variations took place. Despite the use of weighted mobile
average (which smoothens such variations), one can easily find changes of this nature, being
these variations and reversals of behavior one of the parameters used to define the sections in
which islands and margins were analyzed.
The analysis of areas in which sudden variations occurred has shown that, in general, they are
widening or narrowing areas. Figure 155 shows some examples of this behavior in modules
20, 30/31, 41 and 58. In the areas in which the channel undergoes narrowing there is a "dam-
ming effect", with the reduction of energy in the upstream and an increase in the downstream.
As a result of this, there is an increase in sedimentation up to the point where the narrowing
occurs, and from that point on, a tendency to the predomination of erosion. This local change
in transport energy hence provokes the sudden variations with the predomination of sedimen-
tation of margins and accretion of islands, being followed by the erosion or significant reduc-
tion of sedimentation, as was observed throughout the entire area.
lix
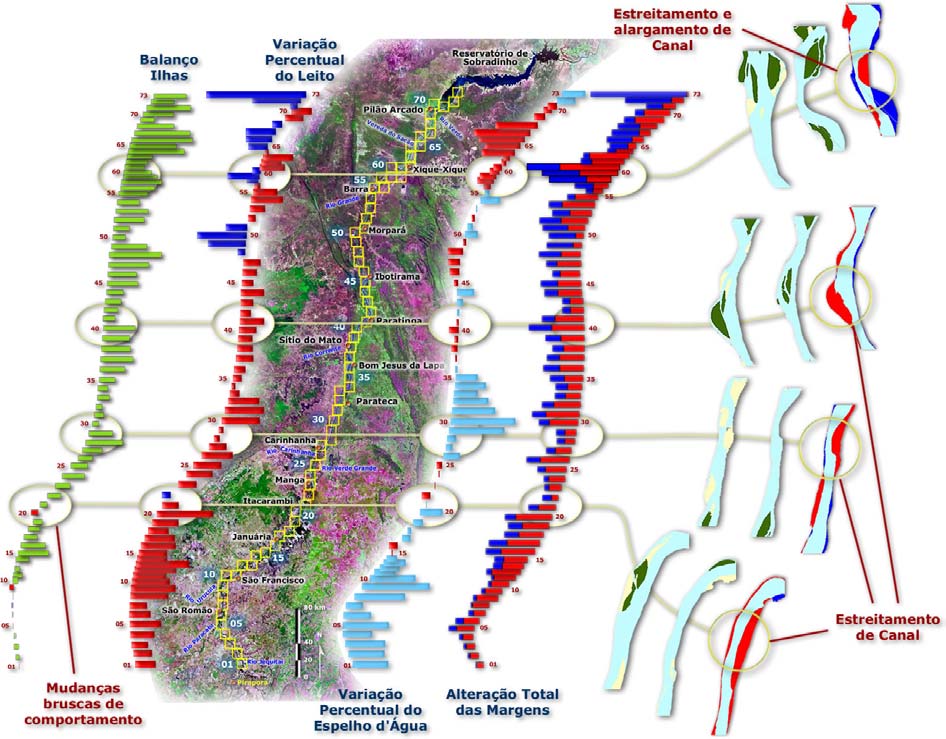
Figure 155. Sudden variations in the behavior of analyzed parameters associated to wid-
enings or narrowings of the channel.
Due to this important interference in the river dynamics, mapping these areas and describing
its hydraulic behavior is another important factor to subsidize sustainable development plans
and/or revitalization plans for the SÐo Francisco Basin.
13.6 Reduction of Hydraulic Gradient and Delta Effect
The construction of Sobradinho Dam, accompanied by the posterior innundation of the reser-
voir, initiated in 1979, caused the reduction of the hydraulic gradient and the consequent for-
mation of a delta in the reservoirÇs stillwater, which initiates in PilÐo Arcado.
This process occurs due to the fact that water stockpiled in SobradinhoÇs reservoir acts as a
bulkhead or "buffer" to the sediment flux, where the waterÇs shockwave during periods of
high rainfall is reduced (or forced to diminish due to the dam)
This reduction of speed forces the reduction of the waterflowÇs speed, which had been drag-
ging and moving the sediments (both the suspension and the drag ones), located in the bottom
part of the riverÇs chute waterflow.
The reduction of the volume of the flux of dragged or suspension sediments proves the miti-
gating factor of the devastating potential of the flus, which demonstrates that SobradinhoÇs
reservoir possesses quite a big weakening index.
Inside SobradinhoÇs reservoir, as the torrentÇs turbulent waters approach those already in re-
gime or in the stage of laminar flux, the mitigating factor of the dam starts to act upon the flux
of sediments.
lx
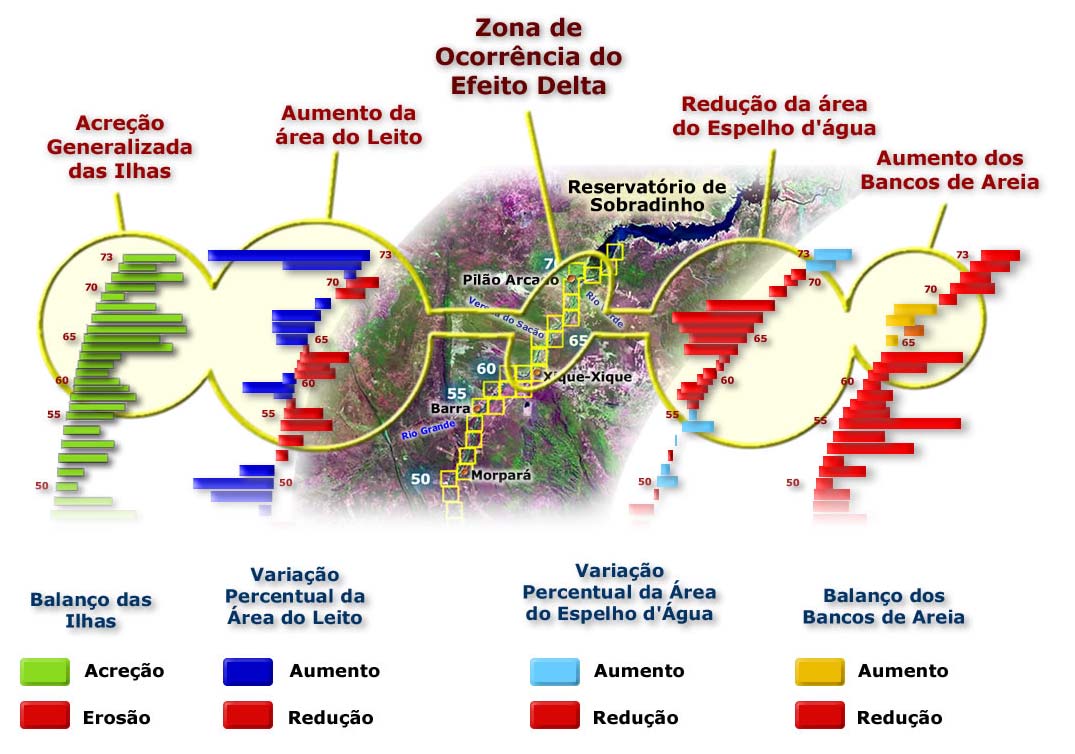
This fact favours the accumulation of sediments, especially in the stillwater zone of Sobrad-
inhoÇs reservoir, once it prevents them from flowing and cleaning the riverÇs chute. Due to the
accumulation of sediments in the reservoirÇs stillwater, the formation of a delta in this zone is
already visible when there is a period of severe drought.
Figure 156 shows that the parameters used in the analysis of the variation of the riverbedÇs
shape have presented a joint behavior differentiated from the downstream of Xique-Xique.
Figure 156. Association of factors that indicate the occurrence of silting up akin to re-
gions of delta from Xique-Xique downstream.
The association of the increase in sandbanks, the accretion and anastomification of islands,
reduction of water surface and widening of riverbed is highlighted. This set of factors indi-
cates a process of silting up common in regions of delta.
This behavior is opposed to the one observed in other sections of the area, especially from
Ibotirama upstream. In this case, there has been a reduction of sandbanks associated to an in-
crease in the percentage of the waterÇs surface. This increase, in its turn, occurred as a conse-
quence of the reduction of the riverbedÇs area.
The accretion of islands, despite having occurred in the entired analyzed area, was intensified
from Xique-Xique downstream. Image analysis has shown additionally a tendency to anas-
tomification, quite characteristic of regions where the excess of sediments forces the subdivi-
sion of the main channel.
This anastomification forces the widening of the riverbed, which occurs specifically in this
region and is well characterized in figure 151 Ù item 13.3. This widening, however, occurs
with the reduction of the water surface, indicating that it is exclusively associated to the in-
crease of islands and sandbanks.
Figure 157 shows examples of changes observed in this section, with pictures. One can notice
that the islands present bigger dimensions than those observed in the initial section and the
sandbanks are numerous.
lxi
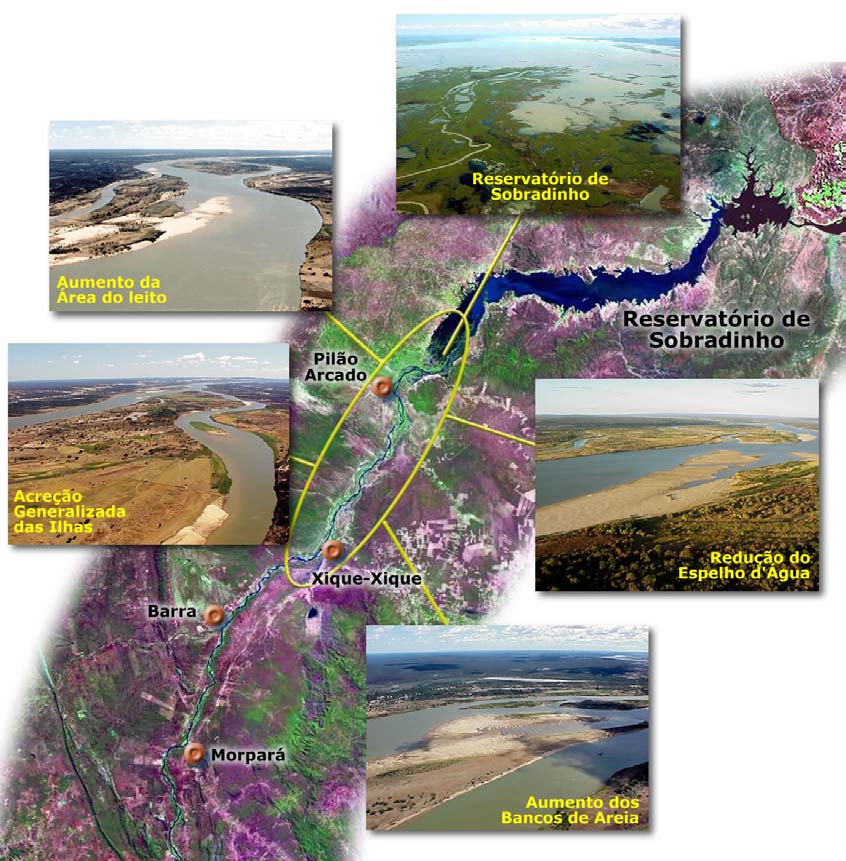
Figura 157. Main features of the conformation of the riverbed in the delta effect region.
Another detail that may be observed in the pictures is that the islands have little vegetation
with a mostly sandy composition, which indicates that they are recent.
This is compatible with the fact that, being a byproduct of the sedimentation associated to the
filling of the reservoir, these islands initiated their formation process or accelerated their ac-
cretion from 1979 on, while the islands of the regions from Xique-Xique upstream are older,
having developed better-defined vegetation.
14. CONCLUSIONS
The multitemporal analysis has shown that there has been many changes in the composition
of the riverbed throughout the analyzed period (see figure 74). These changes are summed in
table 19, which presents additionally the characterization of the alteration, indicating the way
it has been highlighted in the multitemporal analysis, and the reference so as one can find the
detailed description of the process.
Chart 19. Observed Changes, characterization and references.
Observed Change
Characterization of Change
References
Predominance of margin
There has been a 4% reduction of the riverbedÇs Figure 75 (pag. xxxv)
sedimentation
area, and the balance has shown that sedimenta-
tion overcame erosion in the majority of the
Item 13.1.8 (pÃg. xxxix)
lxii
modules.
Figure 109 (pÃg. xl)
Generalized Accretion of The islandsÇcurrent area has suffered an in-
Figure 114 (pag. xliv)
islands
crease of 34% in relation to the original area,
and the balance has shown a predomination of
Item 13.2.8 (pag. li)
accretion in 70 modules out of the total 72.
Figure 146 (pag. li)
Differentiated variation in The percentage of the water surface has shown Item 13.3 (pag. lv)
the percentual contribu-
a differentiated behavior until Bom Jesus da
tion of the water surface
Lapa, where increase has predominated, being
Erro! A origem da re-
to the composition of the followed by equilibrium, between Bom Jesus da ferõncia nÐo foi encon-
riverbed
Lapa and Barra and, from that point on, redu-
trada. (pag. Erro!
tion (as a consequence of the "delta effect" as-
Indicador nÐo
sociated to the proximity of Sobradinho).
definido.)
Reduction of Sandbanks
The current area of sandbanks corresponds to
Item Erro! A origem
only 31% of the original area, and the only
da referõncia nÐo foi
relevant increase occurred near SobradinhoÇs
encontrada. (pÃg.
reservoir.
Erro! Indicador nÐo
definido.)
Figure 152 (pÃg. lviii)
"Delta Effect"
From Xique-Xique downstream and in the
Item Erro! A origem
proximity of SobradinhoÇs reservoir, takes place da referõncia nÐo foi
an association of an increase in sandbanks, ac-
encontrada. (pÃg.
cretion and anostomification of islands, reduc-
Erro! Indicador nÐo
tion of water surface and riverbed widening,
definido.)
which indicates a process of silting up charac-
teristic of delta regions.
Figure 156 (pÃg. Erro!
Indicador nÐo
definido.)
Figure 157 (pÃg. Erro!
Indicador nÐo
definido.)
The way these changes happened was defined by the interaction of changing factors with con-
stant ones during the period. To facilitate the differentiation, the first ones were called tempo-
ral factors, once their effects occurred as a function of time. The last ones were called atempo-
ral factors, once their effects do not depend on time.
These factors are next described and appear also in table 20, where the affected area and the
observed effects are presented.
Temporal Factors
These are the factors that changed throughout the period and whose effectsÇ intensity is asso-
ciated to time. These factors were represented by two items:
a. Reduction of Rate of Flow Ù reduction of around 10% in the average yearly rates of flow
from 1931 on (see Figure 71 Ù page xxxi.), implicating the predominance of sedimentation
of margins and generalized accretion of islands. As a function of the reduction of energy
associated to this reduction in the rates of flow, sandbanks also suffered a significant re-
duction, probably because they moved to the bottom of the river and made the channel
lxiii
shallower. With this the water surface came to represent a greater percentage of the river-
bed area. These effects were observed from Pirapora to Xique-Xique.
b. Reduction of Hydraulic Gradient Ù the Hydraulic gradient has suffered reduction due to
the filling of SobradinhoÇs Reservoir.
With this, the area located from Xique-Xique downstream, which before presented a growing
gradient as it approached SobradinhoÇs waterfall, has suffered a steep reduction of energy as
the waterflow diminishes its speed and draws off in the reservoir.
In this area it may be observed that the influence of the reduction in the rate of flow was miti-
gated due to the quote stabilization effect, having been noticed the increase in sandbanks, the
generalized accretion of islands and the reduction of the water surface, identified as features of
a delta formation process (see Figure 156 Ù page Ù Erro! Indicador nÐo definido.).
Atemporal Factors
These are the constant factors, related to the features of the rocky ground. They were also rep-
resented by two items:
a.
Local changes in the riverbed conformation Ù these are represented by sinuous curves,
by narrowing and/or widening of the channel.
These local changes prevented modifications associated to the reduction in the rate of flow
and in the hydraulic gradient from affecting the river in a constant and regular way. With this
strong variations in the behavior of riverbanks, islands, sandbanks and water surface, in areas
where the original conformation showed some sudden variation. These changes are associated
to the presence of minor geological fractures which locally conditioned the shape and the
preferential direction of the development of the riverÇs channel.
b. Regional Changes in the Nature of the Rocky Ground Ù these are the regional modifi-
cations in the features of the rocky ground, characterized by the change in the type of rock
on which the river is carving its bed.
In regional terms, there is a relevant lithological disagreement by Ibotirama (see Figure 15 Ù
page x), where the river starts flowing on rocks more liable to reshaping. With this, the flood-
ing plain widens, marginal lagoons, trails and alluvial dikes become more common and slopes
become more enclosed. This makes the river to occupy greater areas of the plain during the
heavy waterfall period, which makes changes in the conformation of the riverbed easier,
through the reshaping of areas where the more lasting presence of water throughout the entire
year destabilizes the soil.
As indicated in the table below, this interaction was complex, once factors acted in quite
different forms in each section of the river. Figure 158 depicts this information spatially and
shows how the distribution of these interferences created three main sectors:
Pirapora-Ibotirama, Ibotirama-Xique-Xique e Xique-Xique-Sobradinho.
In these sections changes followed patterns that respond to the combined influence of the fac-
tors identified in this work. In the Pirapora-Ibotirama section there is a combination of the re-
duction in the rate of flow and a more resistant ground.
In the second section, denominated Ibotirama-Xique-Xique, there is a reduction of rate of
flow over an area with a more resistant ground. In the Xique-Xique-Sobradinho section, there
is a reduction of the hydraulic gradient acting on a more resistant ground. Hence, the set of
changes observed in each section was different.
The study did not cover all the variables that accounted for changes in the shape of the river-
bed, but showed which are the main parameters that are defining changes in the analyzed pe-
riod and the tendencies followed by these parameters in their interaction.
lxiv
Temporal Factors
Type
Affected Area
Observed Effects
Reduction in the From Pirapora (MG) to ñ Predominance of sedimentation in the
Rate of Flow
Xique-Xique (BA)
margins;
ñ Generalized accretion of the islands;
ñ Reduction of sandbanks;
ñ Reduction of riverbed area; and
ñ Increase in the percentage of riverbed
comprised by water surface.
Reduction of
From Xique-Xique
ñ Appearance of the "Delta Effect";
Hydraulic Gradient (BA) to the
SobradinhoÇs reservoir ñ Generalized Accretion of the Islands;
stillwater (BA)
ñ Increase of sandbanks;
ñ Increase in riverbed area; and
ñ Reduction of the contribution of water surface
to composition of riverbed.
Atemporal Factors
Type
Affected Area
Observed Effects
Regional variations Affects the entire
ñ Modification in the degree of enclosement of
of the ground
analyzed area.
slopes;
Important lythological
disagreement around
ñ Modification in the extension of flooding
Ibotirama (BA) divides
plain; and
the area in two different ñ Modification in the degree of occurrence of
sections.
alluvial dikes, trails or marginal lagoons;
Local Variations in Affects restricted
ñ Sudden variations in the behavior of analyzed
the shape of the portions in the entire
parameters; and
channel
analyzed area where
there is narrowing
ñ Reversal of Equilibrium;
and/or widening of the
channel, or steep curves
lxv
Chart 20. Behavior of Temporal and Atemporal Factors, area of influence and observed
effects.
Condicionantes Temporais
Type
Affected area
Observed effects
Reduction in the
From Pirapora (MG) to ñ Predominance of sedimentation in the
Rate of Flow
Xique-Xique (BA)
margins;
ñ Generalized accretion of the islands;
ñ Reduction of sandbanks;
ñ Reduction of riverbed area; and
ñ Increase in the percentage of riverbed
comprised by water surface.
Reduction of
From Xique-Xique
ñ Appearance of the "Delta Effect";
Hydraulic Gradient (BA) to the
SobradinhoÇs reservoir ñ Generalized Accretion of the Islands;
stillwater (BA)
ñ Increase of sandbanks;
ñ Increase in riverbed area; and
ñ Reduction of the contribution of water surface
to composition of riverbed.
Atemporal conditionants
Type
Affected area
Observed effects
Regional variations
Affects the entire
ñ Modification in the degree of enclosement of
of the ground
analyzed area.
slopes;
Important lythological
disagreement around
ñ Modification in the extension of flooding
Ibotirama (BA) divides
plain; and
the area in two different ñ Modification in the degree of occurrence of
sections.
alluvial dikes, trails or marginal lagoons;
Local Variations
Affects restricted
ñ Sudden variations in the behavior of analyzed
in the shape of the
portions in the entire
parameters; and
channel
analyzed area where
there is narrowing
ñ Reversal of Equilibrium;
and/or widening of the
channel, or steep curves
The lack of an analysis of the variation in sediment load notwithstanding, due to its impor-
tance in the analysis of the river alteration dynamics, a more detailed study is suggested, by
means of the establishment of a sedimentometric network along the entire SÐo Francisco
River Basin.
As to the reduction in the rate of flow, the nature of this study does not allow for the identifi-
cation of its cause. It is also suggested, with this goal in mind, that a more profound and de-
tailed study is made, taking into consideration the issue of climatic variations through time,
among others.
Despite the fact that the behavior of the river is different in each section, it can be said that if
current tendencies keep on, if the reduction in the rate of flow and in the hydraulic gradient
downstream from Xique-Xique persists, the most likely result should be a growth in changes
along the identified lines.
lxvi
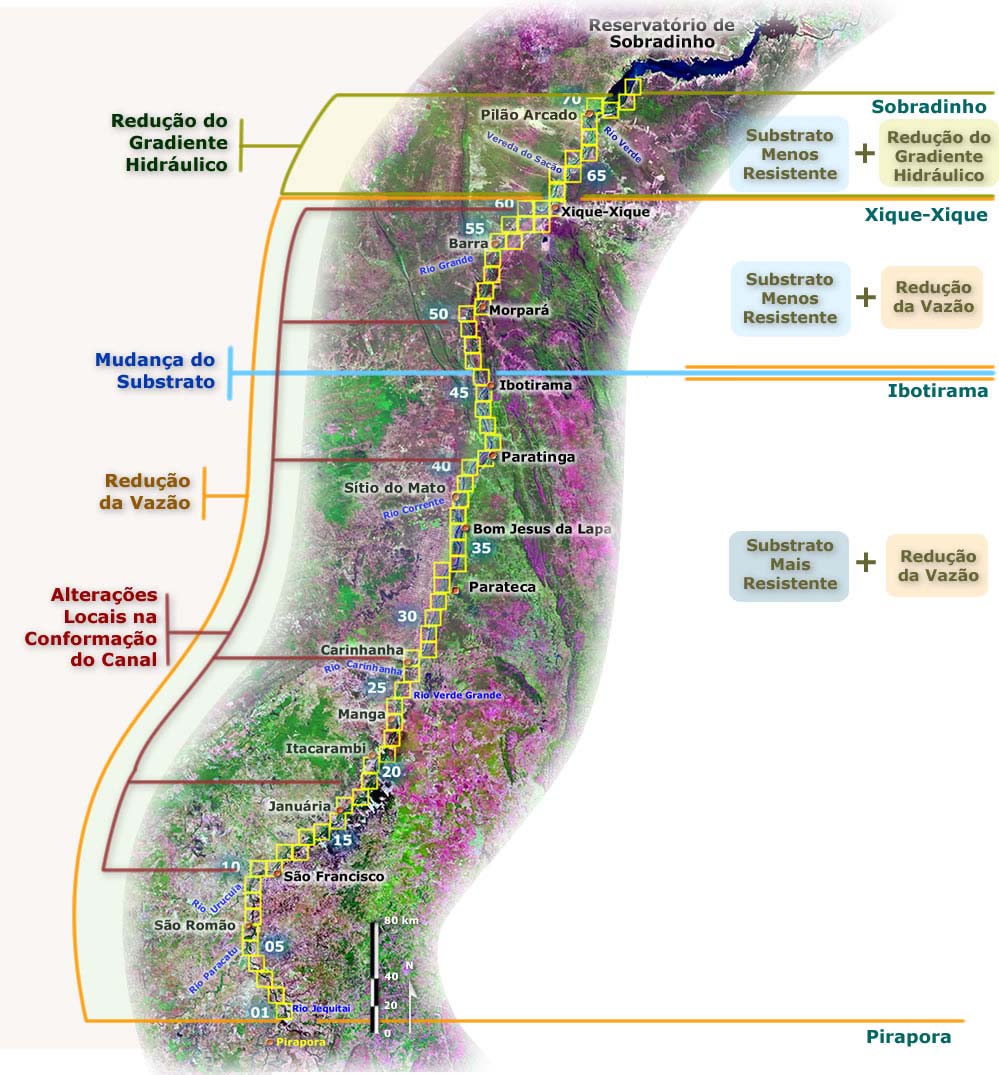
Figure 158. Interaction of factors which caused the changes observed in the shape of the
riverbed.
The identification of the occurred changes makes the tendency of change in the shape of the
riverbed clear, as an adjustment to the new variables. This allows for the planning of actions
aimed at compensating of mitigating these factors.
Thus, it is important to keep on studying this phenomenon, once lack of knowledge about the
true causes may mislead revitalization actions or even prevent regions from developing due to
ill-informed preservation policies.
lxvii
15. RECOMMENDATIONS
15.1 Changes in Methodology
15.1.1 Selection of Image Dates
It is suggested that an analysis of the rate of flow data obtained in the fluviometric stations is
done and that the dates for the image acquisition are defined so as to establish limits for its
variation and to prevent it from influencing the shape of the riverbed.
As the satellite images are affected by the presence of clouds and the recurrence (the timespan
between two passages of the satellite) is around 15 days, a set of ideal dates in which similar
rates are observed is to be defined is obtained. Once the images are obtained in one or more of
these dates, the difference of rates of flow may be controlled.
This procedure will raise costs, once most file images will not be suitable for analysis, but the
trustworthiness of the results will be much greater, once the hypothesis that changes are being
caused by different rates of flow or benchmarks will be ruled out.
15.1.2 Definition of Mapping Modules
The use of mapping modules with a fixed area in geographical coordinates (7,5" x 7,5") has
greatly facilitated the georeferencing work and module concatenation. However, as the river
area within each module varied, an additional difficulty for the assessment of results was cre-
ated, once modified area could be more or less representative, depending on the river area
within a given module.
The adequate solution is to define modules with a fixed river area and not with a fixed module
area. Another option would be to adopt a fixed main channel length, so as the changes ob-
served in each module would be related to this length. This would make processing more
complex, but would generate more trustworthy and easy-to-understand results.
15.1.3 Differentiation of Marginal Deposits and Mapping of Flooding Plains
The difference of behavior between marginal islands and those located in the center of the
riverbed could not be adequately assessed due to a lack of differentiation between these two
kinds of deposit. The marginal islands tend to aggregate themselves to the continent with the
reduction of rate of flow, while central islands tend to suffer accretion. Once both effects are
opposed, in some places this has affected the equilibrium, which makes a visual analysis
mandatory for the proper identification of the processes.
In addition, marginal sandbanks adhere preferentially to the continent, while central sand-
banks are moved by the waterflow or fixated as islands. Due to these distinctions, these mar-
ginal deposits should be differentiated so as the analysis of their behaviour may be individual-
ized.
Along these lines, the flooding plains, with their lagoons, alluvial dikes, old riverbedsÇ scars,
among other conformations, should also be included in the mapping. In the present work this
was not possible once the topo-hydrographical charts not always covered the entire area of the
plains, which impossibilitated temporal analysis.
Nevertheless, by using satellite images available from 1972 on, it is possible to do this map-
ping and the consequent comparison of changes ocurred between analyzed dates.
15.2 Theme mapping of Middle and Upper SÐo Francisco
The physiographical regions of Middle and Upper SÐo Francisco influence the analyzed area and
the absence of up-to-date mapping of the use of land for these regions prevented questions relative
to the anthropic interference on the river from being studied.
lxviii
This way, it is recommended the continuing of the activities of theme mapping through orbital
remote sensing for the entire basin, with the extension of the mapped area to the region of
Middle SÐo Francisco and the update of data relative to the Upper SÐo Francisco region
(mapped by CODEVASF in 1996), and recovered and edited by Project GEF SÐo Francisco.
As a result, there would be a theme mapping for the entire region based on the same
methodology.
15.3 Accomplishment Timetable and Theme Mapping Update
As evidenced in the areas of Upper, Sub-middle and Lower SÐo Francisco, the anthropization
levels are high. Despite the fact that degradation itself is not very intense, this high degree of
anthropization asks for constant and regular supervision of the are, once the difference
between anthropized and degradated area is very thin..
Based on these factors and in the anthropization indexes obtained for the mapped areas, which
vary from 30% to 75%, a timetable for the mapping update was ellaborated. This timetable
took a timespan of three years as a basis for each new mapping. It is also emphatically
recommended that the methodology is maintained, so as the results generated may be
comparatively analyzed.
Therefore, these data will also be able to be used for multitemporal assessments, extremely
useful and conclusive in relation to the evolution of degradation and to the patterns of the use
of land.
15.4 Mapping of Middle SÐo Francisco
The project is to be executed by a team of seven consultants, specialists in digital cartography,
remote sensing, photointerpretation, geoprocessing and geographical information systems, to
be hired for this specific purpose.
In addition to the consultants there will also be resources for stationery and software, satellite
images, air tickets and field acommodation reimbursements, helicopter rental and hardware
upgrade.
The deadline for accomplishment will be of 12 months and costs are estimated in US$
346,040. In this project, CODEVASFÇs share will amount to US$250,000.
15.5 Upper SÐo Francisco Update
The Upper SÐo Francisco update will be executed by a team of six consultants which, as in the
former project, should be specialists in digital cartography, remote sensing, photointerpreta-
tion, geoprocessing and geographical information systems.
The deadline for implementation will be of 10 months and costs are estimated in US$ 272,410.
In this project, CODEVASFÇs share will amount to US$200,000.
15.6 Detailing of Studies of the Dynamics of change of SÐo Francisco Riverbed
The project of detailing of Studies of the Dynamics of change of SÐo Francisco Riverbed will
include analyses of the shape of the riverbed for each five years period from 1972, with the
use of satellite images available from this date on.
In addition to this mapping with a five-year interval, dates previous to the two greatest floods
of the period (1979 and 1983) would also be studied, totalling 11 (eleven) dates. This will
result in a detailed profile of the dynamics of change of SÐo Francisco Riverbed for the entire
period, thus offering a solid basis for all the revitalization, damming or transposition projects
to be planned in the future.
lxix
Work is to be executed by a team of six consultants, who should be specialists in digital car-
tography, remote sensing, photointerpretation, geoprocessing and geographical information
systems.
In addition to these consultants, the project comprises also the hiring of 05 (five) specialists in
the fields of structural geology, pedology, river hydraulics, climatology and geomorphology,
with an experience of 05 (five) years minimum in relevant areas.
Works are to be directed by a coordinator exclusively dedicated to the project along its entire
timetable, being responsible for the orientation of all studies and the ellaborations of partial
and final reports. The deadline for execution will be of 12 months and costs are estimated in
US$796,060. The details of the budget are shown in Table 23. In this project, CODEVASFÇs
share will amount to US$350,000.
Quadro 23. Detalhamento dos estudos da dinãmica de alteraÓÐo da conformaÓÐo do leito
do SÐo Francisco (valores em US$).
15.7 Detailing of Studies of the Dynamics of change of SÐo Francisco Riverbed (figures
in US$).
DISCRIMINATION
Partial
Total
10 Ù ActivityÇs personnel component
1200 Ù Consultancies
246,000
1201 Ù (1 coordinator Ù 3,000/month x 12 months)
36,000
1202 Ù (6 consultants Ù 2,500/month x 12 months)
180,000
1203 Ù (5 specialists Ù 2,500/month x 3 months)
37,500
1600 Ù Trips
22,560
1601 Ù 30 (thirty) Air Tickets
15,000
1602 Ù 120 (One hundred and twenty) Daily accomodation
7,560
reimbursements
1999 COMPONENT TOTAL
276,060
268,560
40 Ù Equipment
30,000
4100 Ù Consumption hardware
4101 Ù Stationery
30,000
4999 COMPONENT TOTAL
30,000
30,000
50 Ù Miscellaneous
110,000
Maintenance
30,000
Satellite Images
80,000
Helicopter Rental
30,000
5999 COMPONENT TOTAL
140,000
140,000
AGGREGATE TOTAL
446,060
446,060
CODEVASFÇS SHARE
350,000
350,000
PROJECTÇS TOTAL
796,060
796,060
lxx
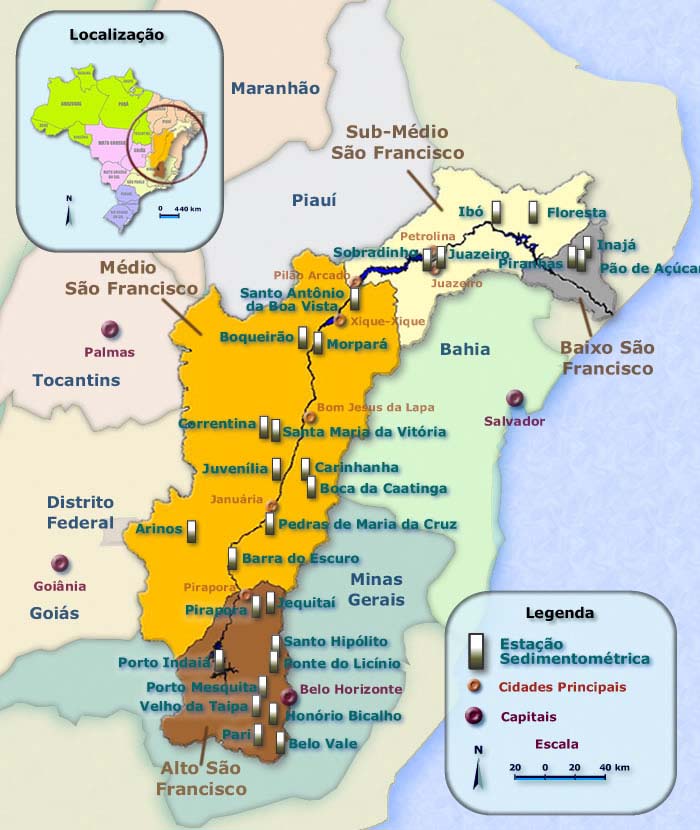
15.8 Operation of Sedimentometric Network
So as sedimentometric studies of the SÐo Francisco River may be made, the implementation
of a Sedimentometric Network with 28 stations, located at the spots indicated in figure 161.
Each station would have a yearly operational cost of around US$ 10,700, totalling US$
299,600 for the entire network.
Figure 161. Localization of sediometric stations
lxxi